Radford University
Data Analysis Activity
What do classmates think? In groups, learners design surveys to investigate chosen topics. They conduct the survey, then analyze the results. As part of the activity, they must calculate the mean, median, mode, variance, and standard...
EngageNY
Calculating Probabilities of Events Using Two-Way Tables
Tables are useful for more than just eating. Learners use tables to organize data and calculate probabilities and conditional probabilities.
EngageNY
Using Sample Data to Estimate a Population Characteristic
How many of the pupils at your school think selling soda would be a good idea? Show learners how to develop a study to answer questions like these! The activity explores the meaning of a population versus a sample and how to interpret...
Radford University
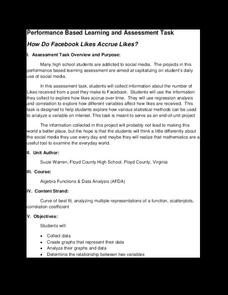
How Do Facebook Likes Accrue Likes?
Finally, a project pupils will instantly like! Young mathematicians collect data on the number of likes they receive for a social media post over time. During the first part of the project, they determine a curve of best fit and...
Curated OER
Graphs and Data
Students investigate poverty using graphs. In this algebra lesson, students collect data on the effects of poverty and use different rules to analyze the data. They graph and use the trapezoid rule to interpret the data.
Radford University
Body Measurement Activity
Don't keep the resource at an arm's length. A hands-on activity has scholars measure the heights, arm spans, hair lengths, and foot lengths of their classmates. They create scatter plots to determine if there is a correlation between...
Willow Tree
Histograms and Venn Diagrams
There are many different options for graphing data, which can be overwhelming even for experienced mathematcians. This time, the focus is on histograms and Venn diagrams that highlight the frequency of a range of data and overlap of...
Willow Tree
Scatterplots and Stem-and-Leaf Plots
Is there a correlation between the number of cats you own and your age? Use a scatter plot to analyze these correlation questions. Learners plot data and look for positive, negative, or no correlation, then create stem-and-leaf plots to...
Willow Tree
Linear Relationships
There's just something special about lines in algebra. Introduce your classes to linear equations by analyzing the linear relationship. Young mathematicians use input/output pairs to determine the slope and the slope-intercept formula to...
Curated OER
Instantaneous Rate of Change of a Function
Pupils draw the graph of a door opening and closing over time. They graph a given function on their calculators, create a table of values and interpret the results by telling if the door is opening or closing and evaluate the average...
Willow Tree
Circle Graphs
Pie isn't just for eating! Scholars learn to create pie charts and circle graphs to represent data. Given raw data, learners determine the percent of the whole for each category and then figure out the degree of the circle that percent...
Illustrative Mathematics
Invertible or Not?
Two for one—create an invertible and non-invertible function from the same data. The task presents a function table with missing outputs for the class to use to create two functions. One of the functions should have an inverse while the...
Willow Tree
Bar Graphs
Circles, lines, dots, boxes: graphs come in all shapes in sizes. Scholars learn how to make a bar graph using univariate data. They also analyze data using those bar graphs.
Shodor Education Foundation
Regression
How good is the fit? Using an interactive, classmates create a scatter plot of bivariate data and fit their own lines of best fit. The applet allows pupils to display the regression line along with the correlation coefficient. As a final...
EngageNY
Sampling Variability in the Sample Mean (part 2)
Reduce variability for more accurate statistics. Through simulation, learners examine sample data and calculate a sample mean. They understand that increasing the number of samples creates results that are more representative of the...
Curated OER
Proportionality in Tables, Graphs, and Equations
Students create different methods to analyze their data. In this algebra lesson, students differentiate between proportion and non-proportional graph. They use the TI-Navigator to create the graphs and move them around to make their...
Concord Consortium
Here Comes the Sun
Many phenomena in life are periodic in nature. A task-based lesson asks scholars to explore one of these phenomena. They collect data showing the sunrise time of a specific location over the period of a year. Using the data, they create...
Curated OER
Analyzing Discrete and Continuous Data in a Spreadsheet
You are what you eat! Your statisticians keep a log of what they eat from anywhere between a day to more than a week, keeping track of a variety of nutritional information using a spreadsheet. After analyzing their own data, individuals...
Concord Consortium
Broken Spreadsheet I
There is power in spreadsheet formulas and learners use this power to model quadratic data. Given a scatterplot of a parabola, pupils create formulas in a spreadsheet to populate the data. The formulas they use lead to an understanding...
Alabama Learning Exchange
Building Functions: Composition of Functions
Hammer away at building different types of functions. An engaging lesson builds on learners' knowledge of domain and range to create an understanding of composite functions. Young scholars learn to write composite functions from various...
Curated OER
Basketball Bounces, Assessment Variation 1
This highly scaffolded, summative assessment tasks learners to choose the model that represents the height of a bouncing basketball given the data in graph and table form. Learners then use the model to answer questions about the...
Curated OER
Basketball Bounces, Assessment Variation 2
This un-scaffold summative assessment tasks learners to use the height of a bouncing basketball, given the data in graph and table form, to choose the model that is represented. Learners then use the model to answer questions about the...
Balanced Assessment
Cost of Living
Math scholars investigate the cost of living in Hong Kong compared to Chicago but must first convert the different types of currency. They then choose a type of graph to compare different spending categories and finish the activity by...
Curated OER
Beginning Modeling for Linear and Quadratic Data
Pupils create models to represent both linear and quadratic equations. In this algebra lesson, students collect data from the real world and analyze it. They graph and differentiate between the two types.


