Curated OER
Make Your Own Temperature Scale
Differentiate between temperature and thermal energy. Your class will build a thermometer using simple materials and develop their own scale for measuring temperature. Discuss with your class and consider why engineers need to understand...
American Chemical Society
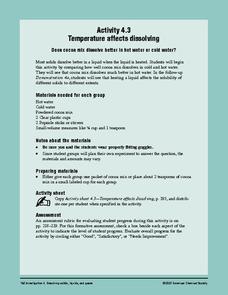
Temperature Affects Dissolving
Stir chocolate drink mix into hot and cold water to see if there is a difference in how quickly it dissolves. Number three in a six-lesson unit on dissolving, this installment investigates the effect of temperature. If you consult the...
NASA
Comparing Temperature and Solar Radiation for Common Latitudes
There's snow much to learn! Excited individuals use real-world data to discover how latitude affects the odds of a snow day. Scientists compare latitude, solar radiation, and temperature using NASA data for several locations....
NOAA
Climate, Weather…What’s the Difference?: Make an Electronic Temperature Sensor
What's the best way to record temperature over a long period of time? Scholars learn about collection of weather and temperature data by building thermistors in the fourth installment of the 10-part Discover Your Changing World series....
Illustrative Mathematics
Comparing Temperatures
Which is colder -12 or -18? Temperature is natural real-world application of ordering rational numbers. It's also fun to talk about the lowest recorded temperature on Earth. Take the time to discuss this inquiry with your class.
Curated OER
Differences Between Ground and Air Temperatures
Students examine the differences between air temperature and ground temperature. In this investigative lesson students find NASA data on the Internet and use it to create a graph.
Chymist
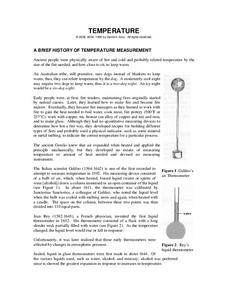
Temperature
Three Dog Night isn't just the name of a band; it is also the way an Australian tribe, who used dogs to stay warm, would describe the temperature on a cool evening. After reading about many different ways of measuring temperature, the...
Curated OER
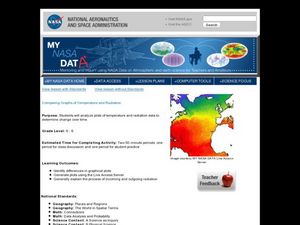
Comparing Graphs of Temperature and Radiation
Students study plots and use a Live Access Server to generate plots. In this temperature lesson students examine the process of incoming and outgoing radiation.
STEM for Teachers
Temperature and Bounce
Take part in a fun experiment and hold an impromptu bouncing contest with your class. Young scientists heat and cool balls before bouncing them to determine whether temperature changes affect how they bounce. The set of STEM lesson plans...
Curated OER
Using Vegetation, Precipitation, and Surface Temperature to Study Climate Zones
Using NASA's Live Access Server, earth scientists compare the temperature, precipitation, and normalized difference vegetation index for four different locations. They use the data to identify the climate zone of each location using...
Curated OER
Temperature
Several slides compare different temperature scales. Thermal expansion, heat transfer, and Maxwell speed distribution are also explored. The last two slides seem unrelated to the topic of heat, but are easily left out of this otherwise...
University of Waikato
Temperature, Salinity and Water Density
The difference between sinking and floating may be a little salt. Young experimenters analyze the effect of salt and temperature on the density of water. They use their results to predict the effect of climate change on ocean ecosystems.
Curated OER
Temperature
Students understand that temperatures in Alaska can be negative numbers. In this temperature lesson, students recognize the temperatures above and below zero. Students compare temperatures using the greater than and less than signs....
Curated OER
Units and Methods of Measurement
Show your class all the ways they will use math in the real world with this online measurement worksheet. 10 multiple choice questions cover concepts such as converting fluid and solid units of measurement, comparing temperatures, and...
Curated OER
A Comparison of Land and Water Temperature
Students examine NASA satellite observations of surface temperature and investigate the seasonal changes of land and water temperature.
Curated OER
Temperature and the Tomato
You will need a photovoltaic system and monitor at your school in order to obtain all of the data required to thoroughly implement this lesson. Your class monitors daily temperature and insolation amounts over a two week span of time....
Curated OER
Linkages Between Surface Temperature and Tropospheric Ozone
High schoolers use data microsets of mean near-surface air temperature and tropospheric ozone residual averages to infer patterns. Students analyze changes in tropospheric ozone and then hypothesize about the consequences of these changes.
Mathematics Assessment Project
Temperatures
As a middle school assessment task, learners first examine line graphs of monthly temperatures for two locations, and then match box plots to each line plot.
NOAA
Graphing Temperatures
Battle of the hemispheres? In the fourth installment of a five-part series, young oceanographers use the NOAA website to collect temperature data from drifters (buoys), one in the Northern Hemisphere and one in the Southern Hemisphere....
Thoughtful Education Press
Compare and Contrast
Encourage readers to compare and contrast the information that they find in informational text with a variety of reading passages and worksheets. Learners read all about subjects in science, social studies, and literature before...
Curated OER
Weather, Weather, Everywhere!
Sixth graders collect weather data to compare temperatures around the world. Using the Internet, learners collect data, put it into spreadsheets, and analyze and graph the results. An interesting way to cover the topic of weather.
Curated OER
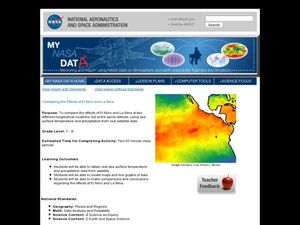
Comparing the Effects of El Nino and La Nina
Students examine the differences between an El Nino and La Nina year. For this investigative lesson students create maps and graphs of the data they obtained.
Curated OER
Charles' Law
High schoolers determine the validity of Charles' Law. In this Charles' Law lesson plan, students measure the volumes of a gas at two different temperatures. They determine the volume at a high temperature and predict using Charles' Law...
Curated OER
Ecosystems and Remote Sensing
Students obtain remote sensing data to compare and contrast global biomass data with global temperature data.


