Fluence Learning
Writing About Literature: Comparing and Contrasting Characters in Heidi
Scholars read excerpts from the story, Heidi, in a three-part assessment that focuses on comparing and contrasting characters. Each part contains three tasks that challenge learners to discuss, answer comprehension...
EngageNY
Describing Distributions Using the Mean and MAD II
The 11th lesson in the series of 22 is similar to the preceding lesson, but requires scholars to compare distributions using the mean and mean absolute deviation. Pupils use the information to make a determination on which data set is...
Fluence Learning
Writing About Literature: Nature in the Writings of John Muir and Emily Dickinson
As an assessment of their skill in crafting a compare and contrast essay, class members read and compare the portrayals of nature in excerpts from naturalist John Muir's My First Summer in the Sierra and from poet Emily Dickinson's...
Inside Mathematics
Squares and Circles
It's all about lines when going around. Pupils graph the relationship between the length of a side of a square and its perimeter. Class members explain the origin in context of the side length and perimeter. They compare the graph to the...
Fluence Learning
Writing About Literary Text: Pygmalion and Galatea
Is it crazy to fall in love with your own work, or is that the purest love of all? Compare two renditions of the classic Greek myth Pygmalion and Galatea with a literary analysis exercise. After students compare the similarities and...
EngageNY
Variability in a Data Distribution
Scholars investigate the spread of associated data sets by comparing the data sets to determine which has a greater variability. Individuals then interpret the mean as the typical value based upon the variability.
Curated OER
Logistic Growth Model, Explicit Version
Via the concrete setting of estimating the population of the US, your algebra learners are introduced to a logistic growth model. Comparing and contrasting logistic, exponential, linear and quadratic models, to see which fits the data...
Concord Consortium
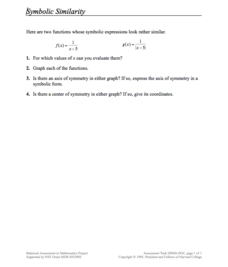
Symbolic Similarity
How many things does one transformation tell you? Learners compare and contrast the graphs of different parent functions with the same transformation. Using a rational and absolute value function, pupils identify key features of their...
Fluence Learning
Writing About Literature Shakespeare and Plutarch
The Oscar for the Best Adapted Screenplay acknowledges a writer's excellence in adapting material found in another source. What do your class members know about adapted resources? Find out with an assessment that asks readers to...
Fluence Learning
Writing About Informational Text: Political Parties
To demonstrate their ability to craft an analysis of informational text, class members read excerpts from James Madison's "The Federalist No. 10," from George Washington's Farewell Address, and from Thomas Jefferson's First Inaugural...
Fluence Learning
Writing About Informational Text: Music and the Brain
Even if you've never picked up a musical instrument, chances are that music has directly impacted your mental and emotional development. Sixth graders engage in a reading activity in which they read two articles on the impact of music on...
Concord Consortium
Square-Ness
Are there some rectangles that are more square than others? A thought-provoking task asks individuals to create a formula that objectifies the square-ness of a set of rectangles. They then use their formulas to rank a set of...
Illustrative Mathematics
Introduction to Linear Functions
Introduce your algebra learners to linear and quadratic functions. Learners compare the differences and relate them back to the equations and graphs. Lead your class to discussions on the properties of a function or a constant slope...
Concord Consortium
Systematic Solution I
Writing a general rule to model a specific pattern is a high-level skill. Your classes practice the important skill as they write rules describing the solutions to a system of equations with variable coefficients. As an added challenge,...
Illustrative Mathematics
The Escalator, Assessment Variation
A great way to practice with unit rates, the activity gives your mathematicians an opportunity to compare different statements and select which are true. They can practice with "choose all that apply" by setting each statement into its...
Illustrative Mathematics
Riding at a Constant Speed, Assessment Variation
Practice ratios and unit rates with tracking how long Lin took to ride her bike. Provided with different questions, your mathematicians can assemble their answers using a chart or setting up ratios. The activity is included in a set of...
Curated OER
Triangles Inscribed in a Circle
Are you tired of answers without understanding? Learners can give a correct response, but do they really understand the concept? Have young mathematicians think deeper about linear functions, angles, and formulas in algebra....
McGraw Hill
Glencoe: Using Graphs to Understand Data Quiz
This is a quiz with five quick questions to check your knowledge of how to use graphs to understand data. It is self-checking.
McGraw Hill
Glencoe: Collecting and Analyzing Data Quiz
This site is a quiz with five quick questions to check your understanding of how to collect and analyze data. It is self checking.


