Curated OER
Linear and Exponential Models
Students investigate the differences between linear and exponential models. In this linear and exponential models lesson, students make a table of given data. Students determine if the data is linear or exponential by plotting the data...
Curated OER
Coefficient of Restitution
Students investigate variables that influence the bouncing of balls. In this exploratory lesson students observe how the manipulated and control variable are correlated by graphing the data.
Kenan Fellows
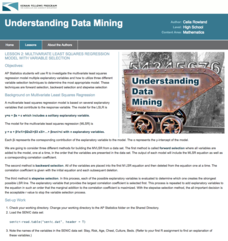
Multivariate Least Squares Regression Model with Variable Selection
The risk of contracting an infection in the hospital is low, but it does happen. Learn what risk factors have the highest correlation with hospital-acquired infections in the final lesson of a three-part series. Using the open source R...
Flipped Math
Unit 5 Review: Bivariate Data
The data says it's a wrap. Pupils work through four review questions with multiple parts dealing with bivariate data. Questions cover creating and interpreting two-way tables and scatter plots with lines of best fit. Scholars finish up...
Radford University
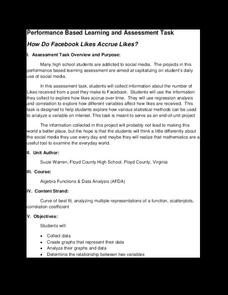
How Do Facebook Likes Accrue Likes?
Finally, a project pupils will instantly like! Young mathematicians collect data on the number of likes they receive for a social media post over time. During the first part of the project, they determine a curve of best fit and...
PHET
Least-Squares Regression
Less is best when looking at residuals. Scholars use an interactive to informally fit a linear regression line to data on a scatter plot. The interactive provides a correct best fit line with residuals and correlation coefficient to...
Curated OER
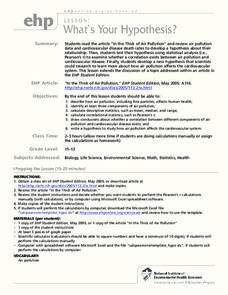
What's Your Hypothesis?
Find the article, "In the Thick of Air Pollution," not through the resource link in the lesson, but through an Internet search. Have high schoolers read it and perform calculations with the statistics provided. The objective is to...
Curated OER
Means of Growth
Students collect and graph data. In this statistics lesson, students analyze their plotted data using a scatter plot. They identify lines as having positive, negative or no correlation.
Curated OER
Correlation and Regression
In this statistics workshop students find the value of linear correlation coefficients in three situations. Students find equations of the regression lines for 4 problems.
EngageNY
Modeling a Context from Data (part 2)
Forgive me, I regress. Building upon previous modeling activities, the class examines models using the regression function on a graphing calculator. They use the modeling process to interpret the context and to make predictions based...
Curated OER
TE Lesson: Factors Affecting Friction
Students investigate the effect of weight on normal friction or the friction due to surface roughness. They tell about the effects of contact area that occurs as a result of molecular attraction by looking at data on line graphs.
West Contra Costa Unified School District
Families of Functions Sort
Have some fun with functions with a short activity that asks learners to first sort scatter plot in terms of their correlation. They then sort graphs of different types of functions in terms of key features, such as slope.
Curated OER
Linear and Quadratic Model, Data Modeling
Students model quadratic and linear equations. In this algebra lesson, students solve word problems using equations. They create scatter plots and make predictions using correlations.
Curated OER
Line of Best Fit
Students identify the line of best fit. In this statistics lesson, students collect and analyze data. They calculate the regression equations and identify the different types of correlation.
Curated OER
Coffee and Crime
Is there a correlation between the number of coffee shops and the amount of crime in a given area? In this quick exercise, your class will examine the data, interpret the results, and discuss their conclusion. Concepts covered include...
Curated OER
Scatter Plots and Line of Best Fit – TV Task
This handout begins by asking your statisticians to form hypotheses on the correlation between test scores and student height and test scores and the number of hours watching TV. Then using specific data, your class will create scatter...
Kenan Fellows
Let's Move
Find a statistical reason for a fresh start. Using a hypothetical scenario, individuals research statistical data of three different cities. Their goal? Find the best statistical reason for a business to move to a new location. Their...
Mathematics Vision Project
Modeling Data
Is there a better way to display data to analyze it? Pupils represent data in a variety of ways using number lines, coordinate graphs, and tables. They determine that certain displays work with different types of data and use two-way...
Kenan Fellows
How Does an Unhealthy Diet Influence our Health and Well-Being?
You are what you eat, or so they say! After surveying family and friends on a week of eating habits, learners analyze the data for patterns. They compare different variables such as fats and cost, fats and calories, or fats and LDLs.
College Board
Engaging the Intuition in Statistics to Motivate
Motivation is key to learning. The author points out that it is important to engage intuition for aspects of statistics that pupils find counter-intuitive. Three strategies—using multiple representations, using intuitive analogies, and...
Teach Engineering
Ramp and Review (for High School)
Rolling for momentum. As part of a study of mechanical energy, momentum, and friction, class members experiment rolling a ball down an incline and having it collide with a cup. Groups take multiple measurements and perform several...
Curated OER
Linear and Exponential Models
Students linearize data to determine if an exponential model is suitable. In this linearizing data to determine if an exponential model is suitable instructional activity, students graph the residuals of sets of data that appear to have...
Curated OER
What a Drag
Middle schoolers learn examples of friction and drag, and suggest ways to reduce the impact of these forces. The equation that governs common frictional forces is introduced, and during a hands-on activity, students experimentally...
Curated OER
Concepts, Patterns, Formulas, Substitution
In this algebra lesson, students define algebraic terms and rewrite them using math symbols. There are 10 problems drawing correlations to geometry as well as algebra.


