Curated OER
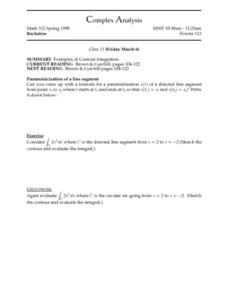
Complex Analysis: Examples of Contour Integration
In this contour integration worksheet, students evaluate an equation, sketch the contour and evaluate the integral. This two-page worksheet contains approximately eight problems.
Curated OER
Applying the Fundamental Theorem of Calculus
In this fundamental theorem worksheet, students identify the anti-derivative and write equations as an explicit function. This two-page worksheet contains two multi-step problems.
Curated OER
I want a credit card--or do I?
Students pretend to borrow $1000.00 on a credit card. They pretend to make the minimum payments for a year. When they're done, they make a pie chart showing how much of their payments reduced their debt, and how much was interest.
Curated OER
Round and Round and Round We Go!
Students investigate motion using a CBL. In this algebra lesson, students collect and graph data on a coordinate plane. They define and identify amplitude and period of conic graphs.
Curated OER
Investigating the Idea of Tan
Fifth graders use tan to solve problems involving right-angled triangles. They solve equations of the form tan(8) =a, for a between 180 degrees and 360 degrees. They state the value of tan (8) in special cases.
Curated OER
Investigating the Idea of Cos
Fifth graders use cos to solve problems involving right-angled triangles. They solve equations of the form cos(++) = a, for a between -180 and 360 degrees. They state the value of cos(++) in special cases and graph y = cos(++).
Curated OER
Squares
In this squares worksheet, 10th graders solve and complete 7 various types of problems. First, they divide a product of one with a square of the other. Then, students find the dimensions of a rectangle that will maximize the area. In...
Curated OER
Graphs And Ellipses
Students become acquainted with linear graphs, the parabola and the rectangular hyperbola. Also prepare tables of paired values as preparation for plotting a line. They study the cartesian equation of an ellipse, with a worked example.
Curated OER
MT-A141 PreCalculus: Worksheet 6.2/6.3
In this precalculus worksheet, students use their graphing calculator to determine the coordinates for given functions. They determine the values for cosine, sign, tangent, and secant of given equations. Given an angle of elevation,...
Curated OER
Graphs and Ellipses
Pupils explore linear graphs, the parabola and the rectangular hyperbola.
Virginia Department of Education
Middle School Mathematics Vocabulary Word Wall Cards
Having a good working knowledge of math vocabulary is so important for learners as they progress through different levels of mathematical learning. Here is 125 pages worth of wonderfully constructed vocabulary and concept review cards....
EngageNY
Complex Numbers and Transformations
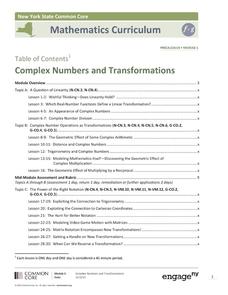
Your learners combine their knowledge of real and imaginary numbers and matrices in an activity containing thirty lessons, two assessments (mid-module and end module), and their corresponding rubrics. Centered on complex numbers and...
Virginia Department of Education
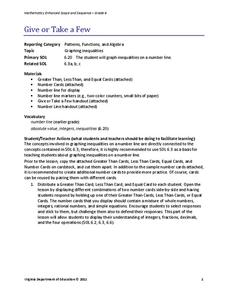
Give or Take a Few
Young mathematicians extend their knowledge of rational numbers on a number line to graph inequalities by first using number cards to compare rational numbers. They finish by using similar reasoning to graph inequalities on a number line.
Mathematics Vision Project
Module 6: Congruence, Construction, and Proof
Trace the links between a variety of math concepts in this far-reaching unit. Ideas that seem very different on the outset (like the distance formula and rigid transformations) come together in very natural and logical ways. This...
Virginia Department of Education
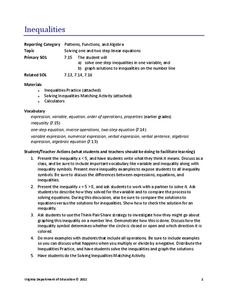
Inequalities
Not all resources are created equal — and your class benefits! Scholars learn how to solve one-step inequalities using inverse operations. They complete an activity matching inequalities to their solutions.
Curated OER
Math Games for Skills and Concepts
A 27-page packet full of math games and activities builds on algebra, measurement, geometry, fractional, and graphing skills. Young mathematicians participate in math games collaboratively, promoting teamwork and skills practice.
Curated OER
Worksheet 7 - Asymptote
In this asymptote worksheet, students compute limits, graph vertical asymptotes, and find the slope of the secant line. This one-page worksheet contains six multi-step worksheets.
Curated OER
Is there Treasure in Trash?
More people, more garbage! Young environmentalists graph population growth against the amount of garbage generated per year and find a linear model that best fits the data. This is an older resource that could benefit from more recent...
Curated OER
Linear Inequalities in One and Two Variables: Rays and Half Planes
Define rays and half planes, including the concepts of boundary lines and prerequisite knowledge of coordinate planes. Given linear inequalities in one and two variables, your class will compare the differences. They will also graph...
Curated OER
Math Regents Exam Questions: Surface Area and Volumes
In this surface area and volume worksheet, students solve 4 short answer and multiple choice problems. Students find the volume and surface area of cylinders and prisms.
Curated OER
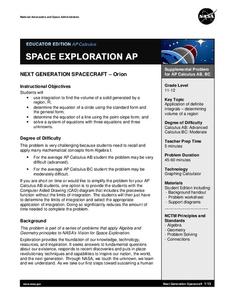
NEXT GENERATION SPACECRAFT-Orion
Students investigate the volume of a solid. In this calculus lesson, students use integration to find the volume of a solid generated by a region, the Orion crew module.
Curated OER
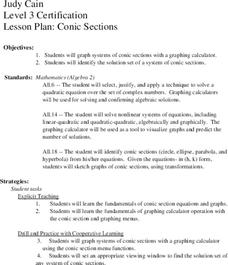
Conic Sections
Students, while using a graphing calculator, graph systems of conic sections as well as identify their solutions. They complete various word problems dealing with conic sections with their calculators. In addition, students sketch graphs...
Curated OER
Loyalists
High schoolers explain why some colonists remained loyal to England during the American revolution. In this social studies lesson, students write a letter to an editor about their reasons for remaining loyal to England.
Curated OER
Bubble Gum Chemistry
Learners explore the concept of graphing data. In this graphing data lesson plan, students determine the percentage of sugar in bubble gum. Learners graph type of gum vs. sugar percentage. Students create a table of their data.
