US Department of Commerce
Featured Activity: Population Change Over Time
Keep track of a state's population. After a brief discussion on how population data is used for funding, individuals look at population changes over time. Pupils find the population of two states using three different censuses. They then...
US Department of Commerce
Immigration Nation
People come and people go. Given tabular census data on the annual number of immigrants from four different regions of the world between 2000 and 2010, pupils create double bar graphs and line graphs from the data. They analyze their...
Curated OER
Mathemafish Population
It's shark week! In this problem, young mathematically minded marine biologists need to study the fish population by analyzing data over time. The emphasis is on understanding the average rate of change of the population and drawing...
It's About Time
Taking a Ride on a Lithospheric Plate
Assist your pupils and broaden their horizons with several activities that determine the exact positioning of various communities over the globe. Pupils use data from the Global Positioning System to determine the position and rate of...
US Environmental Protection Agency
Weather and Climate: What's the Difference?
Future weather forecasters collect daily temperatures over a period of time. Afterward, they compare their data with monthly averages, as researched on national weather websites, in order to grasp the difference between weather and...
Science Matters
Spaghetti Fault Model
Does increasing the pressure between two moving plates provide a stabilizing force or create more destruction? The hands-on instructional activity encourages exploration of strike-split fault models. The sixth instructional activity...
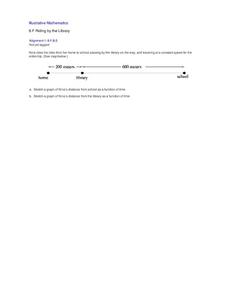
Illustrative Mathematics
Riding by the Library
Draw a graph that shows the qualitative features of a function that has been described verbally. Make sure learners understand where time is zero and the distance is zero. It may take them some time to understand this concept, so working...
NASA
Solar Storms
For this solar storms worksheet, learners use an on line source to read newspaper stories about scientific theories and hypothesis related to space weather phenomena. Students answer 7 questions about past solar storms and compare ideas...
Khan Academy
Challenge: A Loopy Landscape
Drawing trees and grass over and over again is the perfect time to add a while loop to your computer code. This activity guides coders through the steps as they practice using this loop.
Teach It Primary
The Pied Piper of Hamelin
Six tasks make up a lesson plan designed to reinforce comprehension and language skills using the poem "The Pied Piper" by Robert Browing. Scholars discuss and define unknown words, identify adjectives and onomatopoeia, review...
GNS Science
Think like a Geologist: 1
How well do pupils play the role of geologist? Test their abilities in the first installment of a two-part series. Presented with a series of rock formation diagrams, learners write stories to match what they see in the diagrams. The...


