Curated OER
Exponential Expressions - Perfect Squares, Square Roots
Color tiles are used to model perfect squares. Alone or in pairs, middle schoolers will find patterns. Afterward, the relationship between perfect squares and roots will be discussed as a whole class.
Curated OER
Influence and Outliers
Using the TI-Nspire calculator, statisicians identify outliers and their effect on the least-squares regression line. In finding the line of best fit, they determine what points will affect the least squares regressions and what points...
Curated OER
More on Least Squares
In this least squares worksheet, students solve 3 different problems that include determining the least squares of equations. First, they use the data given in the table to write out the normal equations a system of 2 equations in 2...
EngageNY
Interpreting Residuals from a Line
What does an animal's gestation period have to do with its longevity? Use residuals to determine the prediction errors based upon a least-square regression line. This second lesson on residuals shows how to use residuals to create a...
California Education Partners
Least and Greatest
Squares can be magic. Pupils use their knowledge of addition of positive and negative rational numbers to create a 3 X 3 magic square where the sums are 1. Scholars create addition and multiplication expressions with a set of rational...
Curated OER
Punnett Squares
Eighth graders take a short quiz on genotypes and phenotypes. As a class, they are introduced to the concept of Punnett Squares and listen to a description of Gregor Mendel's pea experiment. In groups, they complete Punnett Squares to...
Virginia Department of Education
Line of Best Fit
Pupils work through a guided activity on fitting a linear equation to a set of data by entering the data into a calculator and trying to envision a line of best fit. They then have the calculator determine the least-squares line and...
Curated OER
Lisa Simpson and Math
In this algebra worksheet, high schoolers ponder life's questions presented in several episodes of The Simpson's. They calculate the square root of 1 million and verify known facts concerning pi. There are 9 questions.
EngageNY
More on Modeling Relationships with a Line
How do you create a residual plot? Work as a class and in small groups through the activity in order to learn how to build a residual plot. The activity builds upon previous learning on calculating residuals and serves as a precursor to...
Curated OER
Rational, Irrational and Square Roots
Seventh graders identify rational and irrational numbers and then, estimate the square root of numbers that are not perfect squares. They then identify what the radical is and differentiate between that and a division symbol clearly....
Curated OER
Algebra 1: Simplifying Radicals
After discussing the difference between rational and irrational numbers, the class pratices simplifying, adding, and subtracting radical expressions. They play a game which involves passing around cards until they have matching hands of...
Curated OER
Simplify Radicals
Learners are introduced to the concept of radicals and how to use them in various situations. They review rational and irrational numbers while simplifying different number sentences. They also practice factoring perfect squares.
EngageNY
Analyzing Residuals (Part 1)
Just how far off is the least squares line? Using a graphing calculator, individuals or pairs create residual plots in order to determine how well a best fit line models data. Three examples walk through the calculator procedure of...
Illustrative Mathematics
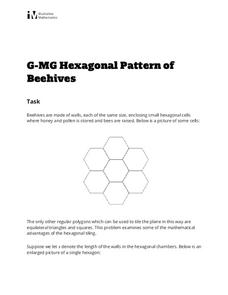
Hexagonal Pattern of Beehives
Young geometers and biologists investigate the math of nature in an activity that is just the bee's knees. Participants will study the tessellations of hexagons in a beehive, along with the natural rationale behind the specific shape....
101 Questions
Dandy Candies
Package design is an economic necessity. Young scholars assume the role in an interesting inquiry-based lesson. Given 24 cubic shaped candies to package, they must determine the arrangement that uses the least amount of cardboard to...
Curated OER
Scatterplots
In this scatterplots worksheet, students construct a scatter plot from a given data set. Students then answer 4 questions regarding the least-squares regression line and making predictions.
Curated OER
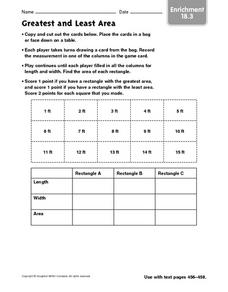
Greatest and Least Area - Enrichment 18.3
In this greatest and least area game worksheet, students cut out the cards, draw a card and record the measurement in the length or width column of a graph. When all columns have been filled, they calculate the areas to find the winner...
Curated OER
Rational, Irrational and Square Roots
Students identify rational and irrational numbers and their use in mathematical functions. Through demonstration, students discover the difference between rational and irrational numbers and their use. Using estimation skills students...
Curated OER
Area of Circles and Probability
Students investigate the area of squares and circles. For this geometry lesson, students calculate the area and probability of simple events. They work on a laptop using Safari.
Curated OER
Square Roots, Number Classification, Ordering & Graphing
Ninth graders identify numbers as rational or irrational. Using calculators estimation, and factoring methods, 9th graders compute the square root of numbers. They graph numbers in sequential order and round numbers integers to the...
Curated OER
Dihybrid Punnett Squares
Students construct Punnett squares to illustrate specific genotypic and phenotypic genetic outcomes.
Students calculate the probability of achieving specific genotypic and phenotypic genetic oucomes, using dihybrid Punnett squares.
EngageNY
Modeling Relationships with a Line
What linear equation will fit this data, and how close is it? Through discussion and partner work, young mathematicians learn the procedure to determine a regression line in order to make predictions from the data.
Curated OER
Going out of Business: Pythagorean Theorem
Students find the length of diagonals. For this Pythagorean theorem lesson, students use the Pythagorean theorem to determine the length of diagonals.
Inside Mathematics
Quadratic (2009)
Functions require an input in order to get an output, which explains why the answer always has at least two parts. After only three multi-part questions, the teacher can analyze pupils' strengths and weaknesses when it comes to quadratic...


