Rice University
Introductory Statistics
Statistically speaking, the content covers several grades. Featuring all of the statistics typically covered in a college-level Statistics course, the expansive content spans from sixth grade on up to high school. Material comes from a...
Curated OER
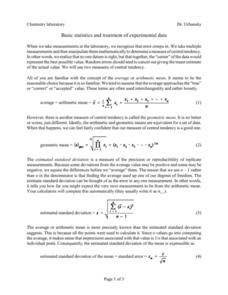
Basic Stats
In this chemistry worksheet, students focus upon the concepts of mean and standard deviation and how it is used in the laboratory to interpret data.
K20 LEARN
Do Placebos Kill Minotaurs?
But it's just a game! Learners play a game to learn basic concepts of statistical hypothesis testing. After using the digital-game module, pupils develop their own statistical hypotheses and test them.
Curated OER
The Three M's of Statistics: Mode, Median, Mean
Young mathematicians use the Visual Thesaurus to define mean, median, and mode. In this mean, median and mode activity, learners use online sources to find the definitions of mean, median, and mode before applying the concepts to a class...
Stats Monkey
Everything I Ever Needed to Learn about AP Statistics I Learned from a Bag of M and M's®
Candy is always a good motivator! Use this collection of M&M's® experiments to introduce statistics topics, including mean, standard deviation, nonlinear transformation, and many more. The use of a hands-on model with these AP...
CK-12 Foundation
Misleading Graphs (Identify Misleading Statistics): Are Virgos Cursed?
Is it safe to take data at its face value? Pupils use the interactive to evaluate a claim that Virgos are more likely to get into a car crash than others. Individuals determine whether another variable may be at play.
Curated OER
Statistics Canada
Learners practice using graphing tools to make tables, bar charts, scatter graphs, and histograms, using census data. They apply the concept of measures of central tendency, examine the effects of outliers. They also write inferences and...
Curated OER
Statistics: Misleading or Accurate?
Students explore the concept of misleading statistics. In this misleading statistics lesson, students play a game of tag and graph the number of times each student gets tagged. Students use the graph to determine the fastest runner in...
Curated OER
Probability and Statistics
Students are taught to search the internet for statistics concepts on sports. In this probability lesson, students collect data and use the calculator to graph and analyze their data. They graph and make predictions about sports using...
Curated OER
An Introduction to Elementary Statistics
Students explain and appreciate the use of statistics in everyday life. They define basic terms used in statistics and compute simple measures of central tendency.
National Security Agency
It's Probably Probable
Learners make predictions and draw conclusions from given information as they learn the meaning of probability in this vocabulary-rich, integrated activity that presents a variety of teaching strategies to motivate and reach all learning...
Shodor Education Foundation
Introduction to the Concept of Probability
Acquaint mathematicians to the concept of probability with a discussion about the results of a game. Then have them play a dice, card, spinner, or coin game and recording the number of wins vs. the number of tries on an interactive web...
CK-12 Foundation
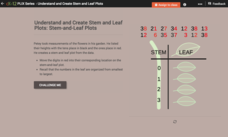
Understand and Create Stem-and-Leaf Plots: Stem-and-Leaf Plots
Explore the advantages to using a stem-and-leaf plot using an online lesson. Learners manipulate an animation to create a stem-and-leaf plot. They then calculate statistics for the data using their display. Guiding questions help them...
College Board
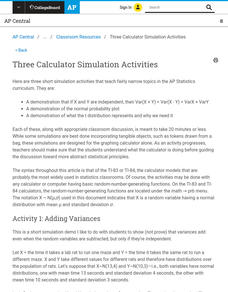
Three Calculator Simulation Activities
Calculators sure come in handy. An AP® Statistics instructional resource provides suggestions for using calculator simulations. It gives activities for adding variances, normal probability plots, and t distributions.
Curated OER
Introduction to Descriptive Statistics
Students follow examples to study basic concepts of statistics. They work independently through the activities.
Curated OER
Data Collection and Graphing
Students collect data and graph it on a coordinate plane and analyze it. In this statistics lesson plan, students display their data collection using a graph. They determine which central tendency will work best.
Curated OER
Do You Feel Lucky?
Students explore probability by using games based on probable outcomes of events. They name all of the possible outcomes of an event and express the likelihood of such an event occurring.
Curated OER
Chances Are......You're Right
Young mathematicians study probability. In this math lesson, learners calculate odds, and convert those into percentages of probability. Fractions are also used, making this lesson quite rich in some of the more difficult conversions...
Learner
Solid Shapes
A collection of two lessons, kindergartners will identify two-dimensional shapes in solid shapes. They will develop basic knowledge of the components that make up a sphere, rectangular prism, pyramid, cylinder, cone, and cube. Young...
Curated OER
Global Statistics
Students determine statistics based on data. In this statistics lesson, students use data and record in charts. Students create graphs based on the statistics found.
Curated OER
Probability: Likelihood and Chance
A presentation demonstrates the basics of probability. Learners consider a variety of scenarios with dice, as well as picking certain-colored balls out of a bag in order to become familiar with this concept. The PowerPoint is brief, but...
Curated OER
Statistics and Shopping
Students examine statistics and data analysis concepts from the practical questions that arise in everyday life.
CK-12 Foundation
Stratified Random Sampling: An Extracurricular Study
Learning isn't a random process. A well-designed interactive lesson helps classes make key conclusions about stratified random sampling. They calculate group percentages and use those percentages to decide on sampling totals.
Math Worksheets 4 Kids
Probability Worksheet
Your learners probably will enjoy practicing a variety of concepts as they work through these eight probability worksheets. The first few worksheets emphasize basic probability using cards, the months in a year, and the number of...


