Curated OER
Exploring Exponential Growth and Decay Functions
Learners differentiate between exponential growth and decay. In this algebra instructional activity, students solve exponential equations using properties of exponents. They use the Ti calculator to graph and analyze their...
Mathematics Vision Project
Structures of Expressions
This comprehensive unit investigates transformations of quadratics, having learners follow "Optima" through the development and growth of her quilting business. Deftly weaving the story into the mathematical mechanics, the unit gives...
EngageNY
Algebraic Expressions—The Distributive Property
Do your classes truly understand the distributive property? Use a demonstrative lesson to represent the distributive property in various ways. Learners solidify understanding by creating a geometric pattern for distributive...
EngageNY
Trigonometry and Complex Numbers
Complex numbers were first represented on the complex plane, now they are being represented using sine and cosine. Introduce the class to the polar form of a complex number with the 13th part of a 32-part series that defines the...
Concord Consortium
It's In the Mail
It's time to check the mail! The task is to determine the most cost-effective way to mail a packet of information. Young scholars write an equation that models the amount of postage as a function of the number of sheets mailed and...
CK-12 Foundation
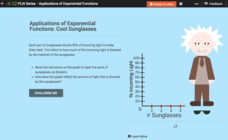
Exponential Decay: Cool Sunglasses
Who wouldn't want to wear four pairs of sunglasses? Each pair of sunglasses reduces the percent of incoming light by one-half. An interactive tutorial helps young mathematicians build a graph that models this scenario. They...
Curated OER
Patterns, Functions, and Algebra: Wired for Space
Young scholars assess how patterns, functions and algebra can assist NASA engineers design new ways of propelling spacecrafts. They explore how electricity and magnetism are replacing the fuel-consuming rocket propulsion....
Curated OER
Functions & Algebra
Students examine linear equations. In this functions and algebra lesson, students write equations in the slope-intercept form. They enter data in a graphing calculator, examine tables, and write linear equations to match the data.
EngageNY
Modeling Riverbeds with Polynomials (part 2)
Examine the power of technology while modeling with polynomial functions. Using the website wolfram alpha, learners develop a polynomial function to model the shape of a riverbed. Ultimately, they determine the flow rate through the river.
EngageNY
Mid-Module Assessment Task - Algebra 2 (Module 3)
The 15th installment of a 35-part module is a mid-module assessment task. Covering concepts in the first half of the module, the task acts as a formative assessment, providing you with valuable information on how learners are doing.
Illustrative Mathematics
Logistic Growth Model, Abstract Version
Here learners get to flex some serious algebraic muscles through an investigation of logistic growth. The properties of the constant terms in the logistic growth formula are unraveled in a short but content-dense...
Concord Consortium
In a Triangle
What's in a triangle? Just 180 degrees worth of angles! Young learners use given angle relationships in a triangle to write an algebraic representation. Using a system of equations, they simplify the equation to a linear representation.
Desmos
Desmos Graphing Calculator
They say a graph is worth a thousand points. The interactive allows users to graph a wide variety of functions and equations. Using the included keyboard or typing directly into the list, learners determine the graph of a function....
Charleston School District
Pre-Test Unit 4: Linear Funcitons
Let your classes show you what they know! Use this pre-test to assess the current knowledge of your learners. The assessment includes all pre-algebra concepts related to functions: writing and graphing linear relationships, comparing...
Benjamin Franklin High School
Saxon Math: Algebra 2 (Section 3)
In this third of a twelve-part series, the focus moves from using matrices to solving systems of equations with substitution and elimination, including more than two dimensions and variables in equations, and analyzing statistical data....
Curated OER
Celebrating the Fourth of July!
Learners model projectile motion algebraically and graphically; and make predictions based on the quadratic algebraic model.
Curated OER
Exploring Quadratic Data with Transformation Graphing
Using a data collection device to collect data regarding a bouncing ball, students use various features on graphing calculators to experiment with the parameters of the vertex form of the parabola and their effect on the shape of the...
Curated OER
Exponential Reflections
High Schoolers explore the concept of exponential reflections. They use their Ti-Nspire to reflect the natural logarithm function over the line y=x. Students repeat the process using different exponential functions using a slider.
Texas Instruments
Finding Linear Models Part III
Explore linear functions! In this Algebra I lesson, mathematicians graph data in a scatter plot and use a graphing calculator to find a linear regression and/or a median-median line. They use the model to make predictions.
Curated OER
Solving Equations Using Models
Explore mathematics by analyzing images. As they view pictures on the SMART Board, individuals must write corresponding algebraic equations. They utilize models to visualize the math expressions.
Curated OER
Latitude
Your young geologists generate a graph given a table of values from the context of latitude and percent of the earth's surface north of that latitude. The questions in the activity then focus the learners to a deeper understanding of the...
Concord Consortium
Swimming Pool II
Combine geometry and algebra concepts to solve a modeling problem. Young scholars consider the effect surface area has on volume. They write a cubic function to model the possible volume given a specific surface area and then...
EngageNY
The Graph of a Function
Mathematics set notation can be represented through a computer program loop. Making the connection to a computer program loop helps pupils see the process that set notation describes. The activity allows for different types domain and...
EngageNY
Graphs of Quadratic Functions
How high is too high for a belly flop? Learners analyze data to model the world record belly flop using a quadratic equation. They create a graph and analyze the key features and apply them to the context of the video.

