Illustrative Mathematics
Average Cost
Here is an activity that presents a good example of a function modeling a relationship between two quantities. John is making DVDs of his friend's favorite shows and needs to know how much to charge his friend to cover the cost of making...
Statistics Education Web
Types of Average Sampling: "Household Words" to Dwell On
Show your classes how different means can represent the same data. Individuals collect household size data and calculate the mean. Pupils learn how handling of the data influences the value of the mean.
Curated OER
Value Venture
Students examine how the value of an item may be different for different people and investigate how perceived value helps determine the price of items in the marketplace. They list what they consider to be the most valuable items in the...
Curated OER
Bikini Bottom Olympics Skill: Best Value and Uncertainty
For this best value and uncertainty worksheet, learners solve multiple problems where they calculate the best value, the uncertainty and the range in the data given.
Illustrative Mathematics
Fred's Fun Factory
Spin to win! Individuals calculate the average number of tickets expected based on a probability distribution for the number of tickets per spin. Pupils use that information to determine the average number of tickets that can be won...
Curated OER
Place Values - Subtracting
Learners explore the concept of place value. In this place value lesson, students subtract numbers from a specific place value.
Curated OER
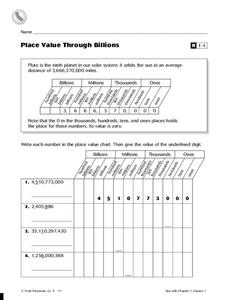
Place Value Through Billions
Place value reading skills are the focus of this lesson. Students are given an example of Pluto's orbit distance from the sun to introduce the concept of the billions place value. Students are then given four numbers in the billions, and...
Curated OER
Find the possible values for the Median
In this online math learning exercise, students find values for the median given a variety of sets of data. This excellent resource allows the students to check their answers, and to get "hints" should they run into difficulties. A...
Curated OER
See Turtles Nest! See Turtles Hatch!
Students graph data of sea turtles hatching rates from Watamu/Malindi Marine National Park and Reserve in Kenya. In this math lesson, students use real life science data to calculate mean and median values. Students use the data to...
US Environmental Protection Agency
Carbon Through the Seasons
Meteorologists view an animated video by the Environmental Protection Agency to learn how the carbon cycle works, and then move into groups to analyze and graph actual data of the atmospheric carbon dioxide concentration from Hawaii's...
Curated OER
Mean Value Theorem - An Application
In this mean value worksheet, students read a short story problem about driving from one city to another. They use the given information and the mean value theorem to determine why an officer stopped the driver and issued a ticket. ...
Curated OER
Solving Open Sentences Involving Absolute Value
In this math worksheet, students solve 6 open sentences and graph solutions using a line graph. Students then express 2 story problems in terms of inequalities. Students then write open sentences for 2 graphs.
Curated OER
How To Make Faint Things Stand Out In a Bright World!
In this averaging and pixel activity, students solve 5 problems including finding the average value of 9 images given pixels, distinguishing between background 'noise' and the source and detecting faint sources in bright backgrounds.
West Contra Costa Unified School District
Average Rate of Change
The concept of slope gets an approachable, yet theoretical, treatment in a comprehensive algebra lesson. The use of functional notation and problem-solving techniques keep the material rigorous, but detailed teaching notes and lots of...
Global Oneness Project
The Value of Ancient Traditions
Imagine having to give up cell phones, computers, and TV? What would be lost? What gained? An examination of the Drokpa, a nomadic people who live in the grasslands of Tibet, provides class members an opportunity to consider how access...
Curated OER
Week in Review 3
In this advanced math instructional activity, students calculate work, average value of a function, and integrate various functions with respect to x. There are 16 questions.
Curated OER
Functions
In this functions worksheet, students solve and complete 5 different sets of problems that include determining functions on intervals. First, they define a definite integral and the Fundamental Theorem of Calculus. Then, students draw a...
Space Awareness
The Climate in Numbers and Graphs
Weather versus climate: weather relates to short time periods while climate averages the weather of a period of many years. Scholars learn about average temperature and precipitation in various climate zones and then apply statistics...
Curated OER
Applications of the Pythagorean Theorem - Magnetism
Middle and high schoolers use the Pythagorean Theorem to complete a table showing with the magnetic field strengths in given cities. They find the average value of the Earth's magnetic field and plot one of the three-dimensional values...
Curated OER
Using Averages
For this math worksheet, young scholars compute the range, mean, median and modal weight of candy bars from two machines. Students write a short essay about which machine is using too much chocolate and which is more reliable.
Curated OER
Central Tendency
In this central tendency instructional activity, 8th graders solve 10 different problems that include determining the mean, mode, and median of various situations. First, they prepare a frequency distribution with a class interval for...
Curated OER
Data Management and Probability: Applications
In this data management and probability applications worksheet, 7th graders solve 13 different types of problems that include finding the mean, median, mode, and range of each set of values, as well as, solving a number of word problems....
Centre for Innovation in Mathematics Teaching
Ten Data Analysis Activities
This thirteen page data analysis worksheet contains a number of interesting problems regarding statistics. The activities cover the concepts of average measurements, standard deviation, box and whisker plots, quartiles, frequency...
Curated OER
Changing It Up
How should a cashier stock a cash register with coins? Learners use mathematical modeling and expected value to determine how many rolls of coins of each type they should place in a cash register.


