Curated OER
MP3 Purchase Plans
Use algebra to solve real world problems. Mathematicians practice use of graphs, tables, and linear functions to solve a problem regarding mp3 purchase plans. They work in groups to solve the problem and present their findings and...
Curated OER
Algebra 2 - Linear Programming
Students read real world problems, determine the variables, and set up the function using algebraic statements. After entering data into the graphing calculator, they display information in the form of graphs and scatter plots. ...
Curated OER
Linear Equations and Algebraic Symbols
Students rewrite word problems using the correct symbols. In this algebra lesson, students simplify algebraic expressions and use the correct representation of the unknown. They solve equations using one and two steps operation.
Balanced Assessment
Number Trick
Show your classes the magic of numbers. Using a number trick, learners practice writing algebraic expressions. They then use their expression to perform the trick. Their exploration should help them understand the magic behind the trick.
EngageNY
Modeling a Context from a Verbal Description (part 1)
When complicated algebraic expressions are involved, it is sometimes easier to use a table or graph to model a context. The exercises in this lesson are designed for business applications and require complex algebraic expressions.
Curated OER
Algebra I: Linear Functions
Using rates from a rental car company, young mathematicians graph data, explore linear relationships, and discuss the role of slope and the y-intercept. This lesson allows for the discussion of independent and dependent variables, as...
Curated OER
Volume of Solids: Algebra/Geometry Institute
Use this volume of solids lesson to have learners find the surface area and volume of cylinders, pyramids, and prisms. They place cubes inside three-dimensional figures to determine the volume. Worksheets and answers are provided.
Illustrative Mathematics
Peaches and Plums
According to the resource graph, which costs more: peaches or plums? Algebra learners compare two proportional relationships and then throw in a banana. Leaving out the scale helps students become intuitive about graphing.
Balanced Assessment
Transformation I
Rewriting expressions in different forms is an essential algebra skill. Support the development of this skill by using a task that asks scholars to begin with a linear, quadratic, and rational expression and then manipulate them into a...
CK-12 Foundation
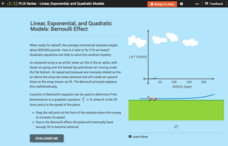
Linear, Exponential, and Quadratic Models: Bernoulli Effect
How can an object as heavy as an airplane fly? Turns out the answer is quadratic! Your classes explore the Bernoulli Effect through an interactive graph representation. As a plane increases in speed, the lift force also increases. Young...
101 Questions
25 Billion Apps
Learn to use mathematics to your advantage! Using linear modeling, scholars predict the date and time the Apple App Store reaches 25 billion downloads. Considering the prize for the 25 billionth download was a $10,000 gift card, modeling...
Curated OER
Long Distance Phone Plans
For this long distance phone plane worksheet, students compare various phone plans and determine which long distance plan has the greatest savings. Students support their answers visually through the use of tables and graphs. They write...
Curated OER
Algebra: Sorting, Representing, and Patterns
Students sort objects and create patterns. In this sorting and graphing lesson, students work at centers to find a way to sort a group of objects, then make a graphical representation of the number of each item. Finally, students create...
Curated OER
Algebra: Co-ordinates
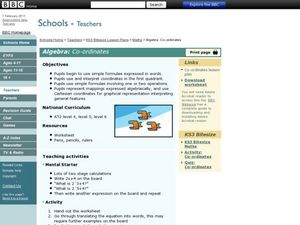
Students use Cartesian coordinates. In this graphing instructional activity students use simple formulae, interpret coordinates, and create graphical representations. They express their work algebraically.
Curated OER
Algebra II: Quadratic Functions
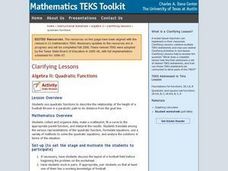
Students collect and organize data, make a scatterplot, fit a curve to the appropriate parent function, and interpret the results. Students translate among the various representations of the quadratic function, formulate equations, use a...
West Contra Costa Unified School District
Matching Quadratic Functions
Ever sigh when learners ask why they have to know so many different forms of the quadratic equation? Here is a lesson that comes in handy! Using hands-on matching activities, quadratic equations are explored through their graphical...
West Contra Costa Unified School District
Introduction to Logarithms
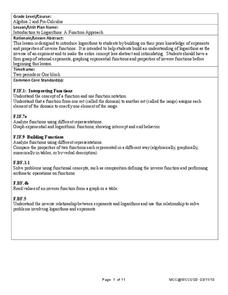
Build on pupils' understanding of inverse functions by connecting logarithmic functions to exponential functions. This activity allows individuals to see graphically the inverse relationship between an exponential and logarithmic...
National Security Agency
Systems of Equations and Inequalities
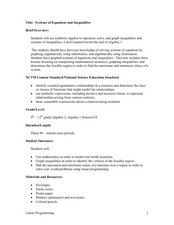
High school classes can use manipulatives too! Offer hands-on, interactive lessons that venture away from the typical day in your algebra class. Young mathematicians will be involved in collaborative learning, visual representations, and...
EngageNY
Systems of Equations
What do you get when you cross a circle and a line? One, two, or maybe no solutions! Teach learners to find solutions of quadratic and linear systems. Connect the visual representation of the graph to the abstract algebraic methods.
Curated OER
Another Way of Factoring
Focusing on this algebra lesson, learners relate quadratic equations in factored form to their solutions and their graph from a number of different aspects. In some problems, one starts with the original equation and finds the solutions....
West Contra Costa Unified School District
Conics Introduction and Parabolas
Where did conic sections get their name? The equation and graph of a parabola are developed from the definition of the conic section. Teacher examples on graphing the equation and writing an equation from the graph round out the plan.
Curated OER
Monopoly Graphs
Students relate the concepts of linear functions to the game of monopoly. In this algebra lesson, students solve problems with ratio and proportion. They collect data and graph it.
Curated OER
Which Car Should I Buy?
Students use gas mileage of different cars to create T charts, algebraic equations, and graphs to show which gets better mileage. In this gas mileage lesson plan, students use the graph to see which car they should buy.
Curated OER
Next Perfect Square
In this secondary mathematics worksheet, learners determine the algebraic representation for the next perfect square after a given number, x. The one page worksheet contains one problem with the solution.


