Curated OER
Does cloud type affect rainfall?
Student use MY NASA DATA to obtain precipitation and cloud type data. They create graphs of data within MY NASA DATA. Learners compare different cloud types, compare precipitation, and cloud type data They qualitatively describe graphs...
Curated OER
Trends of Snow Cover and Temperature in Alaska
Students gather historical snow cover and temperature data from the MY NASA DATA Web site. They compare this data to data gathered using ground measurements from the ALISON Web site for Shageluk Lake. They graph both sets of data and...
Curated OER
Cold, Clouds, and Snowflakes
Students explore satellite data and graphing. In this weather data analysis math and science lesson, students analyze NASA satellite data to draw conclusions about geographical areas where precipitation might have happened. Students...
Curated OER
Differences Between Ground and Air Temperatures
Students examine the differences between air temperature and ground temperature. For this investigative lesson students find NASA data on the Internet and use it to create a graph.
Curated OER
The Reason for the Seasons
Students compare graphs of their data that was generated on a NASA website. In this seasons lesson students complete a lab activity.
Curated OER
Exploring the Water Cycle
The water cycle is one of earth's most easily observable processes, but demonstrating each step within classroom walls can be a challenge. Through a series of videos and quick demonstrations, cover each aspect of the hydrologic cycle in...
NASA
The NBL Pool
That is a lot of water. Class groups explore the size of the NASA's Neutral Buoyancy Pool and calculate the volume of water needed to fill it. They then compare that volume to the amount of water needed to fill a pool the size of a...
Curated OER
A Comparison of Cloud Coverage over Africa
Students identify different climate regions and local weather patterns. In this cloud coverage lesson students use NASA satellite data and import it into Excel.
Curated OER
Solar Cell Energy Availability From Around the Country
Students determine areas that are the most likely to produce solar energy by using NASA data. In this solar energy lesson plan students analyze plots and determine solar panel use.
NASA
Newton’s Cool in the Pool
Pupils work together to investigate the cooling of NASA’s Neutral Buoyancy Laboratory. Using data collected as the pool cooled, groups determine the values needed in Newton's Law of Cooling equation to model the situation. They...
Chicago Botanic Garden
Plant Phenology Data Analysis
Scientists monitor seasonal changes in plants to better understand their responses to climate change, in turn allowing them to make predictions regarding the future. The last activity in the series of six has scholars analyze BudBurst...
Curated OER
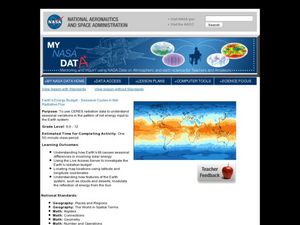
Earth's Energy Budget - Seasonal Cycles in Net Radiative Flux
Students attempt to understand seasonal variation by viewing images of the energy received by the earth. In this weather lesson, students view images from NASA of the influx of energy from the sun and make predictions about resulting...
Curated OER
Identifying Ozone Variations over Different Locations
Learners analyze ozone data. In this atmosphere lesson, students will use a NASA resource to gather data for different regions of the Earth. Learners will then create a graph for their data and answer related questions.
NASA
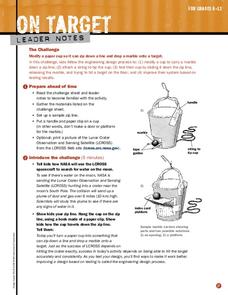
On Target
NASA's LCROSS mission is dropping a probe into a lunar crater. Groups design a system to travel down a zip line and drop a marble onto a target in the classroom. The groups then modify their designs based upon testing.
NASA
Simulating Weightlessness
Floating across the top. Class groups examine the parabolas, written as parametric equations, that model the flight path of NASA's C-9 as it simulates weightlessness. They continue their exploration by changing the parameters to...
NASA
Climate Change Online Lab
What are the key indicators that show scientists that our planet is in the fastest warming trend ever? Learners go on a WebQuest to examine the evidence for themselves. Following several links to NASA sites, kids see how the global...
NASA
Oh, Chute!
Using a scare model of the a test vehicle developed by the Systems Architecture and Integration Office at NASA, groups determine the dimensions for a scale model of the parachute compartment. The groups also determine the volume of the...
Chicago Botanic Garden
Climate Change Around the World
It is unknown if cloud cover increases in response to carbon dioxide levels changing, helping climate change slow down, or if cloud cover decreases, allowing Earth to warm faster. Part four in the series of five lessons has classes...
Curated OER
Our Solar System - Comparing Planetary Travel Distances
NASA presents a mini-unit on distances in our solar system. It incorporates scientific concepts of gravity, mass, density, and payload while your aspiring astronauts also employ mathematics skills. They calculate speed, they determine...
NASA
Freshwater Availability Classroom Activity
This science assignment produced by NASA teaches inquiring minds the distribution of Earth's water. Learners will appreciate and understand the importance of fresh water and how weather and climate affects everything.
NASA
Lights on the International Space Station
Groups explore illumination with NASA's Lighting Environment Test Facility (LETF) as a context. Using the TI-Nspire app, groups determine the lux equation that models their simulation. They then use the lux equation to solve problems...
Curated OER
Star Count
Fourth graders explore the night sky with their star counter. They to determine the types of stars and the number that can be seen from their local area and share their data via the Internet. They participate in NASA online projects.
Curated OER
Living in Space
Students explore space science by viewing a video in class. In this astronaut lesson, students identify the living habits of astronauts by researching the NASA website and observing a space science video in class. Students participate in...
Alabama Learning Exchange
Can Plants Be Grown in Space?
Young scholars investigate finding a solution to growing plants in space. They define key vocabulary terms, conduct an experiment growing plants, explore various websites, and participate in a live video conference with NASA regarding...
Other popular searches
- Nasal Passages
- About Nasa
- Nasa Planets
- Nasa Robots
- Nasa Lesson Math
- Nasa Aircraft
- Nasa Materials
- History of Nasa
- Nasa Lesson Plans
- Nasa Web Based Textbook
- Nasa Aurora
- Contributions of Nasa


