Google
Graphing with Google Docs & Forms
Get to know your class and teach about data analysis all with the help of Google Docs. Using student-generated questions, create a class survey using Google Forms. Reserve time in the computer lab for learners to complete the form and,...
Curated OER
Data! Data! Graph that Data!
Fifth graders create data graphs using Microsoft Excel. For this data collection lesson, 5th graders create and conduct a survey, then use Excel to organize and graph their data.
Curated OER
kind of Bean
Third graders sort different types of beans and collect the data. They create a data table, put the information on the data table and then graph their results. They answer follow-up questions.
Curated OER
Great Graphing
Young scholars collect data, use a computer spreadsheet program to create various graphs, and compare the graphs. They state the findings of each graph in writing and decide which graph type best represents the data.
Curated OER
Designing a Study
Students explore features to consider when designing a scientific study. In this science research instructional activity, students examine different methods of data collection and consider which method would be appropriate for...
Florida Department of Health
Safe and Happy: Safety for All at School and Online Unit
Bystander or upstander and advocate? Three lessons have high schoolers investigating data about bullying and school safety. Participants then learn how to take a stand against bullying and use what they have learned to create a PSA to...
Curated OER
M & M Madness
Students work with the mathematics unit of collection, organization, and presentation of data. In this math and technology lesson plan, students use Valentine M & M’s and The Graph Club to sort and graph the various colored M & M’s.
Curated OER
Pollution and Environmental Studies- Daily Water Use
In this environmental studies worksheet, students create a data table to discover how much water each person uses on a daily basis and what it is used for. They complete a post activity to make and test solutions for pollution using a...
Curated OER
Jellybean Graphs
Second graders predict and graph data based on the color of jelly beans they think are in a handful. In this prediction lesson plan, 2nd graders will predict how many of each color jellybean are in a handful. Then they graph these...
Curated OER
The Hot Dog Stand
Students run a computer simulation. They collect data as they work and use the data to create an annual report for their business. Several different simulations could be used for this project. It is desirable for students to do this...
Curated OER
Temperature High and Lows
Students gather high and low temperature readings through email. In this temperature graphing lesson, students use a spreadsheet to input data for a graph. students interpret the graphs to compare and contrast the data from different...
Curated OER
EXCEL It!
Students surf the Web gathering information about graphs. The data collected is incorporated into an Excel spreadsheet and graphs of varying nature generated to further enhance student understanding.
Curated OER
How Do You Find Stock Symbols?
Students practice finding stock symbols by company, industry, and country. Stock symbols are necessary to find company information such as stock charts, news, and financial data on the Internet.
Curated OER
M & M Madness
Second graders graph M & M's by color. In this graphing lesson plan, 2nd graders first predict how many of each color they think are in a handful of M & M's. Then they graph the amounts of each color on a computer program....
Curated OER
Examine Methods of Reporting Research Results
Students analyze a research report and the list of components needed in a research report and then identify those components based on a set of standards using the scientific method. They collect data which can be used for a graphical...
Curated OER
Discovering Differences Between Internet Search Engines
Students explore the differences in search engines available on the Internet. Most users are unaware of the differences between search engines. Some sample larger or smaller portions of the World Wide Web than others.
Curated OER
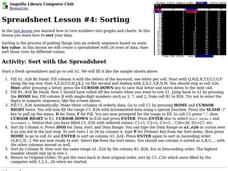
Sorting
Students examine how sorting is the process of putting things into an orderly sequence based on some key value. For this lesson students create a spreadsheet with 26 rows of data, then sort those rows by different values.
Federal Reserve Bank
Arts and Economics Infographic Questionnaire
How do careers in the arts contribute to America's gross domestic product? Use an informative infographic that details the economic details of careers in the core arts, including design services, performing arts, and arts education, to...
Curated OER
DATABASE INTRODUCTION AND BASIC APPLICATIONS USING STUDENT FAMILY TREES
Students gather information about family, parents, and grandparents using the database form. They place their personal information into the database and save the information to compile class in formation. They develop skills in database...
Curated OER
Embracing Diversity
Students explore and use different computer programs for collecting data. For this technology based lesson, students set up a survey and use the Excel and Lotus software to collect data.
Curated OER
American Revolution Power Point Presentation
Fourth graders explore the American Revolution. In this United States history and technology lesson, 4th graders complete a worksheet using information about the causes of the American Revolution. Students create a Power Point...
National Research Center for Career and Technical Education
Information Technology: Photoshop Scale
Scaling is a practical skill as well as a topic to be addressed throughout the Common Core math standards. You are given three different presentations and a detailed teacher's guide to use while teaching proportion, as well as practice...
Curated OER
Around the World in 10 Days
Students engage in producing responses to "what" questions and their written responses will be recorded in a Travel Journal. They produce their respones using a word processor. This lesson is very detailed and a rubic is included.
Curated OER
Dino-Myte Spreadsheet
Do your learners like dinosaurs and theme parks? An ambitious lesson invites learners to put together a plan for supplying dinosaurs for a new theme park. Pupils work together in groups to come up with their plan, which must include a...


