Shodor Education Foundation
Regression
How good is the fit? Using an interactive, classmates create a scatter plot of bivariate data and fit their own lines of best fit. The applet allows pupils to display the regression line along with the correlation coefficient. As a final...
Curated OER
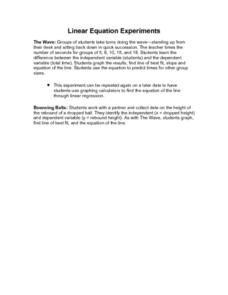
Linear Equation Experiments
In this linear equation learning exercise, students solve and complete 2 different experiments that include using linear equations. First, they determine the difference between independent and dependent variables. Then, students graph...
Kenan Fellows
Least Squares Linear Regression in R
The task? Determine the how effective hospitals are at reducing the rate of hospital-acquired infections. The method? Data analysis! Using an open source software program, individuals use provided data and create scatterplots to look for...
Curated OER
When Will We Ever Use This? Predicting Using Graphs
Here are a set of graphing lessons that have a real-world business focus. Math skills include creating a scatter plot or line graph, fitting a line to a scatter plot, and making predictions. These lessons are aimed at an algebra 1...
Concord Consortium
Heights and Weights
Height is dependent on weight—or is it the other way around? Given data from a physicians handbook, individuals compare the height and weight of males and females at different areas. They calculate differences and ratios to assist with...
Curated OER
What's Your Shoe Size? Linear Regression with MS Excel
Learners collect and analyze data. In this statistics lesson, pupils create a liner model of their data and analyze it using central tendencies. They find the linear regression using a spreadsheet.
EngageNY
Modeling a Context from Data (part 2)
Forgive me, I regress. Building upon previous modeling activities, the class examines models using the regression function on a graphing calculator. They use the modeling process to interpret the context and to make predictions...
Inside Mathematics
Coffee
There are many ways to correlate coffee to life, but in this case a instructional activity looks at the price of two different sizes of coffee. It requires interpreting a graph with two unknown variables, in this case the price, and...
Virginia Department of Education
Linear Modeling
An inquiry-based algebra lesson explores real-world applications of linear functions. Scholars investigate four different situations that can be modeled by linear functions, identifying the rate of change, as well as the...
Curated OER
Fast Talker - Ch 2 project
Tongue Twisters?! Create scatter plot graphs based on timing fellow classmates saying tongue twisters. Then investigate, display, and analyze the relationships based on functions. Wrap up this activity by making a...
Curated OER
Data Analysis
In this data analysis worksheet, 8th graders solve and complete 4 different problems that include determining the line of best fit for each. First, they write the prediction for an equation for each situation described. Then, students...
Curated OER
Environmental Agents of Mathematics: Mathematics for Change
High schoolers analyze environmental science data using Math. They do research about renewable energy, gather data, create graphs and interpret their findings. Then the group presents their arguments persuasively using their findings to...
Teach Engineering
Statistical Analysis of Flexible Circuits
Scholars connect statistical analysis with flexible electric circuits. They first learn about flexible circuits and their applications through a PowerPoint presentation and then consider how the fabrication process for these circuits...
Curated OER
Scatter Plots
In this Algebra I/Geometry/Algebra II worksheet, students create a scatter plot and analyze the data to determine if the data show any type of correlation. The four page worksheet provides extensive explanation of topic,...
Curated OER
Is there Treasure in Trash?
More people, more garbage! Young environmentalists graph population growth against the amount of garbage generated per year and find a linear model that best fits the data. This is an older resource that could benefit from more recent...
Learning Games Lab
The Magic of Reading Graphs
Making conclusions from graphs doesn't need to seem like magic. Learners explore an interactive lesson on reading graphs to strengthen their skills. The content discusses how to read the axes of a graph and draw conclusions based on the...
Illustrative Mathematics
Coffee by the Pound
This is a great exercise in graphing proportional quantities to interpret the unit rate as the slope of a graph. It is not easy for learners to understand what a unit rate is. When it is presented as the slope of a linear line graph,...
Curated OER
To Be Linear or Not to be Linear, That is the Question
Students use their knowledge and understanding of equations of lines to explore independent and dependent variables. They determine how to isolate a variable and how to predict data points not represented in data.
Curated OER
Introducing Linear Terminology
Ninth graders graph linear equations and inequalities in two variables and then, they write equations of lines and find and use the slope and y-intercept
of lines. They use linear equations to model real data and define to define the...
Curated OER
Line & Scatter (What Would You Use: Part 2)
Learners discuss line graphs and scatter plots and the best situations in which to use them. Using the graphs, they determine the type of correlation between variables on a scatterplot. They create a scatterplot and line graph from a...
Curated OER
From Playing with Electronics to Data Analysis
Learners collect and Analyze data. For this statistics lesson, students identify the line of best fit of the graph. They classify lines as having positive, negative and no correlation.
Curated OER
Calculus at the Battle of Trafalgar
Students read an article on how calculus is used in the real world. In this calculus lesson, students draw a correlation between the Battle of Trafalgar and calculus. The purpose of this article is the show everyday uses for calculus in...
Curated OER
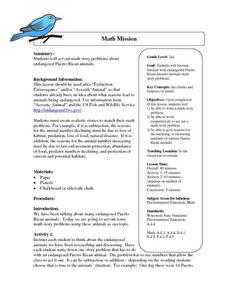
Math Mission
Second graders investigate the concept of Puerto Rican animals through using math word problems. They create a story to correlate with the word problems. The instructional activity also uses data of species counts to show increases and...
Curated OER
Bungee M&M's
Eighth graders experiment with M&M's and a cup attached to a spring to to simulate a bungee jump. They graph the results of the experiment and make predictions for continuing the experiment. They determine the "line of best fit."


