Curated OER
Data, Data, Everywhere... and What Am I To Think?
Students demonstrate good random sampling techniques for data collection, select and develop graphic presentations of data and analyze the data to solve a problem presented.
Curated OER
Using Data to Determine the Location of the Stiffest Opposition to School Desegregation in the 1970's
Students analyze historical data. In this school desegregation lesson, students make predictions about opposition to desegregation, examine the provided desegregation data, and determine if their predictions were correct.
Curated OER
Creating a Thematic Map
Students create and analyze a weather-related data table and a thematic map based upon information provided.
Bowland
Speed Cameras
Do speed cameras help reduce accidents? Scholars investigate this question using a series of spreadsheet activities. Along the way, they learn about randomness, probability, and statistical analysis.
Intel
Play Ball!
Math and sports meet on the baseball diamond in the first STEM lesson in a series of six that asks pupils to collect and perform comparative analyses of data specific to baseball. Following the analysis, scholars create a presentation...
Noyce Foundation
Digging Dinosaurs
Build a function to solve problems rooted in archeology. A comprehensive set of five lessons presents problems requiring individuals to use functions. The initial lesson asks learners to find the possible number of dinosaurs from a...
Curated OER
Information at a Glance - Using Tables in Mathematics
Students create table to display GED Testing data located in paragraph provided by teacher, use information in table to create appropriate graph, and determine percentage difference between passing scores and failing scores.
Noyce Foundation
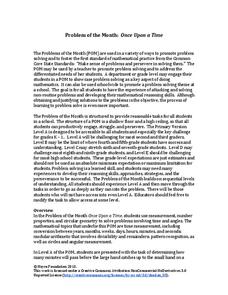
Once Upon a Time
Examine the relationship between time and geometry. A series of five lessons provides a grade-appropriate problem from elementary through high school. Each problem asks learners to compare the movement of the hands on a clock to an angle...
Noyce Foundation
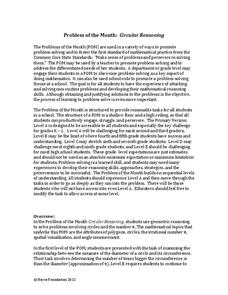
Circular Reasoning
Examine the origin and application of pi in five different levels. The five lessons in the resource begin with an analysis of the relationship between the radius and circumference of a circle. The following lessons lead learners through...
Noyce Foundation
Double Down
Double the dog ears, double the fun. Five problems provide increasing challenges with non-linear growth. Topics include dog ears, family trees and population data, and geometric patterns.
Curated OER
How High Are the Clouds?
Pupils analyze height and collect data to create a graph. In this statistics lesson, students use central tendencies to analyze their data and make predictions. They apply concept of statistics to other areas of academics to make a...
University of Kansas
Newspaper in the Classroom
Newspapers aren't only for reading—they're for learning skills, too! A journalism unit provides three lessons each for primary, intermediate, and secondary grades. Lessons include objectives, materials, vocabulary, and procedure, and...
Curated OER
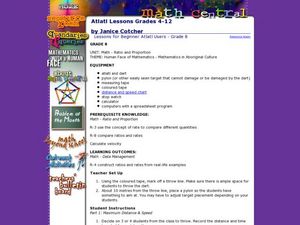
Atlatl Lessons Grade 4-12
Students experiment with velocity, ratios, and rates. In this data management lesson plan, students throw a dart with and without using an atlatl and collect and record various data. Students construct ratios based on the data and...
Curated OER
Biospheres in Your Backyard
Students collect data from a local river biome. They use the information for metric conversion and graphing equations. They study the components of what makes up a biosphere and how math is used to analyze one.
Curated OER
Cancer City USA
Learners investigate a phenomenon known as the cancer cluster. Students determine potential cancer clusters given real data and support their findings using mathematical calculations. Learners Create a graphical representation of the...
Alabama Learning Exchange
Attitude Determines Altitude
A fabulous lesson which combines mathematics with space science. Middle schoolers work in cooperative groups in order to research early astronauts and their accomplishments. They look at a variety of rocket and space shuttle designs, and...
Curated OER
In the Wake of Columbus
Students explore how the population decreased in native cultures.
New York State Education Department
TASC Transition Curriculum: Workshop 5
Are video games sports? Pupils investigate this question as well as various nonfiction selections to learn more about claims and the support that defines them. All of the selections mimic the rigor on state tests and encourage close...
EngageNY
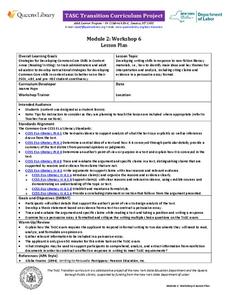
TASC Transition Curriculum: Workshop 6
Is a college education necessary for success in today's world? The class investigates the question, along with others at the end of the sixth workshop in a 15-part series. The lesson has four parts with multiple activities and...
Curated OER
Is the Hudson River Too Salty to Drink?
Students explore reasons for varied salinity in bodies of water. In this geographical inquiry lesson, students use a variety of visual and written information including maps, data tables, and graphs, to form a hypothesis as to why the...
Curated OER
Make That Shot!
Learners figure out basic percentages by shooting paper balls into a basket, recording results, and calculating individual and team percentages for ten shots.
Curated OER
Burial Ground
Students visit the burial ground at Huguenot Street and work in groups to calculate the average lifespan for a resident in the 1700's and one in the 1800's. They analyze the grave markers for further information.
Curated OER
Pooling Around
Students complete a unit of lessons on computing area and volume. They play a Jeopardy game of basic area formulas, calculate surface area of shapes, develop a Powerpoint presentation, and conduct a simulation of finding the surface area...
Curated OER
Standard Linear Form
Ninth graders identify and describe the x-intercept as the place where the line crosses the x-axis as it applies to football. They create their own differentiations to reinforce the distinction between the x-intercept and the...
Other popular searches
- Literary Analysis Plot
- Literary Analysis Paper
- Literary Analysis for Poetry
- 9th Grade Literary Analysis
- Literary Analysis on Quotes
- Writing Literary Analysis
- Literary Analysis the Hobbit
- Test for Literary Analysis
- Literary Analysis Pocahontas
- Writing a Literary Analysis
- Literary Analysis Essay
- Literary Analysis Plays


