Education World
Edible Resource Maps!
Young scholars discuss resource maps and examine examples from library resources. Working in groups, they create edible resource maps by drawing examples, such as popcorn on the border of Iowa and Nebraska. Then they use cookies in the...
Curated OER
Use Google Maps to Teach Math
Capture the engagement of young mathematicians with this upper-elementary math lesson on measuring time and distance. Using Google Maps, students first measure and compare the distance and time it takes to travel between different...
EngageNY
How Do Dilations Map Segments?
Do you view proofs as an essential geometric skill? The resource builds on an understanding of dilations by proving the Dilation Theorem of Segments. Pupils learn to question and verify rather than make assumptions.
PHET
Mapping the Field of Multiple Dipole Magnets
So you built a magnetometer, now what? High school scientists use their magnetometer made in a previous lesson to map the union of magnetic fields of dipole magnets. They experiment with different alignments and draw conclusions about...
Novelinks
The Giver: Reading Road Map
Sometimes it's helpful to read certain passages in a novel slowly and carefully, and to read other parts more quickly to move the plot along. Learners tread carefully through Chapter 20 of Lois Lowry's The Giver, noting which...
Just Health Action
What Makes a Community Healthy?
Young people have an opportunity to make it a beautiful day in their neighborhoods with an activity that asks them to identify what is healthy and unhealthy in their community and develop some ideas about what they can do to fix the...
EngageNY
How Do Dilations Map Angles?
The key to understanding is making connections. Scholars explore angle dilations using properties of parallel lines. At completion, pupils prove that angles of a dilation preserve their original measure.
EngageNY
How Do Dilations Map Lines, Rays, and Circles?
Applying a learned technique to a new type of problem is an important skill in mathematics. The lesson asks scholars to apply their understanding to analyze dilations of different figures. They make conjectures and conclusions to...
Teaching Oasis
Gingerbread Baby Lesson Plan Guide
Reinforce reading comprehension and story mapping skills with the help from a story, Gingerbread Baby by Jen Brett. Individuals discover new vocabulary, make predictions, retell main events, respond to reading using a graphic...
Rainforest Alliance
Knowing the Essential Elements of a Habitat
To gain insight into the many different types of habitats, individuals must first get to know their own. Here, scholars explore their school environment, draw a map, compare and contrast their surroundings to larger ones. They then...
Howard Hughes Medical Institute
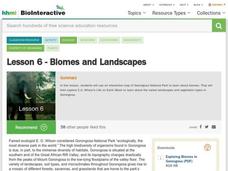
Lesson 6: Biomes and Landscapes
Aside from the amazing animals in Gorongosa National Park, what else is there to discover? The sixth installment in an eight-part themed series contains an interactive map where scholars can learn more about the geographic features of...
Center for Learning in Action
Water – Changing States (Part 2)
Here is part two of a two-part lesson in which scholars investigate the changing states of water—liquid, solid, and gas—and how energy from heat changes its molecules. With grand conversation, two demonstrations, and one hands-on...
Beacon Learning Center
What Goes Up Must Come Down
After your class has completed The Cay by Theodore Taylor, assess understanding of the plot. First, model how to fill out a plot line for your class. Next, have class members fill in the plot of The Cay on the provided story map. Invite...
Smithsonian Institution
A Ticket to Philly—In 1769: Thinking about Cities, Then and Now
While cities had only a small fraction of the population in colonial America, they played a significant role in pre-revolutionary years, and this was certainly true for the largest city in the North American colonies: Philadelphia. Your...
Chicago Botanic Garden
Historical Climate Cycles
What better way to make predictions about future weather and climate patterns than with actual climate data from the past? Young climatologists analyze data from 400,000 to 10,000 years ago to determine if climate has changed over...
Core Knowledge Foundation
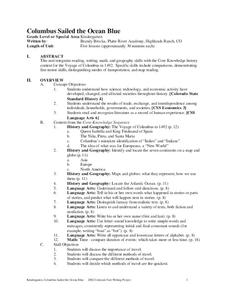
Columbus Sailed the Ocean Blue
Young adventurers embark on a journey, setting sail along the blue ocean with Christopher Columbus. Teachers will find that this unit makes their lesson planning smooth sailing!
NOAA
Into the Deep
Take young scientists into the depths of the world's ocean with the second lesson of this three-part earth science series. After first drawing pictures representing how they imagine the bottom of the ocean to appear, students...
Center for Learning in Action
Water—Changing States (Part 1)
Here is part one of a two-part lesson in which scholars investigate the changing states of water—liquid, solid, and gas. With grand conversation and up to three demonstrations, learners make predictions about what they think will happen...
August House
The Ogre Bully
English language arts, math, science, dramatic arts, and cooking; this lesson has it all! In this multidisciplinary resource, your scholars will take part in a read aloud of The Ogre Bully by A.B. Hoffmire and have a grand...
Hastings Prince Edward Public Health
What is Health?
Many indicators of health are beyond a teenager's control, but there are many changes they can make in their daily life that can improve their health. Middle schoolers think about their physical, social, and mental health status before...
Curated OER
Introduction to Age of Absolutism
Who were the absolute monarchs of Europe and what effect did they have on their countries? Young historians begin by naming qualities they believe are important for a monarch to possess. They then take notes on four key factors...
EngageNY
Graphing Quadratic Functions from Factored Form
How do you graph a quadratic function efficiently? Explore graphing quadratic functions by writing in intercept form with a lesson that makes a strong connection to the symmetry of the graph and its key features before individuals write...
EngageNY
Forming a Research-Based Claim: Cascading Consequences Charts
Life is all about choices and consequences. Using a Cascading Consequences chart, scholars create a visual map of the effects of a particular choice or action related to water management. With their researcher's notebooks and copies of...
EngageNY
Getting a Handle on New Transformations 2
Use 2x2 matrices to move along a line. The second day of a two-day instructional activity is the 28th installment in a 32-part unit. Pupils work together to create and solve systems of equations that will map a transformation...
Other popular searches
- Making Maps Geography
- Making Maps and Research
- Making Maps Using Technology
- Making Maps of History
- China, Making Maps
- Making Maps of Community
- Reading Making Maps
- Neigborhoods and Making Maps
- Making Maps Lesson Plans
- Making Maps Usign Technology
- China Making Maps
- Neighborhoods and Making Maps


