EngageNY
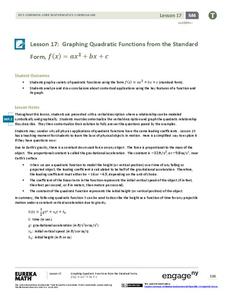
Graphing Quadratic Functions from the Standard Form
Use context to explain the importance of the key features of a graph. When context is introduced, the domain and range have meaning, which enhances understanding. Pupils use application questions to explore the key features of the graph...
EngageNY
Graphs of Simple Nonlinear Functions
Time to move on to nonlinear functions. Scholars create input/output tables and use these to graph simple nonlinear functions. They calculate rates of change to distinguish between linear and nonlinear functions.
Illustrative Mathematics
Graphs of Power Functions
There are parent functions, and then there are parent functions with a really interesting way to explore them. High schoolers are asked to graph different combinations of parent functions together and determine the point of intersection....
Balanced Assessment
Toilet Graph
Mathematics can model just about anything—so why not simulate the height of water in a toilet bowl? The lesson asks pupils to create a graphical model to describe the relationship of the height of the water as it empties and fills again....
World Wildlife Fund
Graphs and Charts
A two-part worksheet incorporating bar graphs and pie charts, young mathematicians can practice their graphing skills. Pupils answer questions using graphs and charts but are also challenged to create their own using a given set of data.
West Contra Costa Unified School District
Connecting Graphing and Solving Absolute Value Equations and Functions
Can you solve an equation graphically? Absolutely! This Algebra II lesson makes the connection between solving an absolute value equation and graphing two functions. Graphing absolute value functions is presented through the process of...
Willow Tree
Circle Graphs
Pie isn't just for eating! Scholars learn to create pie charts and circle graphs to represent data. Given raw data, learners determine the percent of the whole for each category and then figure out the degree of the circle that percent...
Illustrative Mathematics
Graphing Rational Functions
The slider feature on Desmos excellently shows how graphs change based on different variable values. Learners look at two similar rational functions and compare and discuss what happens when the numbers go from positive to zero to...
Concord Consortium
Graphing Elements
How do you graph a sentence? Scholars do just that as they represent relationships between independent and dependent variables with a graphical representation. Given a sentence, they determine the pertinent relationship and create a...
Mt. San Antonio Collage
Quadratic Functions and Their Graphs
Starting with the basics, learners discover the features of a parabola and the ways to accurately graph it. After pupils practice with graphing, the end of the activity focuses on application type problems.
Mt. San Antonio Collage
Graphs of Rational Functions
Sometimes graphing rational functions can feel a little "irrational." Starting with the basics, learners work their way through the pieces of these graphs and finish off with an application question.
EngageNY
Interpreting Quadratic Functions from Graphs and Tables
Seeing functions in nature is a beautiful part of mathematics by analyzing the motion of a dolphin over time. Then take a look at the value of a stock and maximize the profit of a new toy. Explore the application of quadratics by...
Houston Area Calculus Teachers
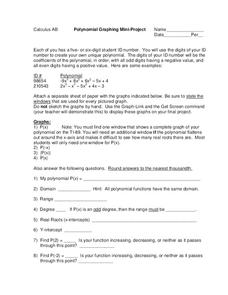
Polynomial Graphing
Your AP Calculus learners probably have their ID numbers memorized, but have they tried graphing them? Pique your pupils' interest by asking each to create a unique polynomial function based on their ID numbers, and then analyze the...
Worksheet Place
How I Get to School
Find out how many of your learners take the bus, how many walk, and how many bike with a quick survey. Class members gather data about how each individual gets to school and mark the results on this page in order to create a bar graph.
Flipped Math
Calculus AB/BC - Sketching Graphs of Functions and Their Derivatives
Find deeper meaning in graphs. Pupils use the knowledge gained from the previous sections in the unit to sketch graphs of a function's derivative. Learners also see how to sketch a graph of a function given the graph of its derivatives....
EngageNY
Graphs of Quadratic Functions
How high is too high for a belly flop? Learners analyze data to model the world record belly flop using a quadratic equation. They create a graph and analyze the key features and apply them to the context of the video.
CK-12 Foundation
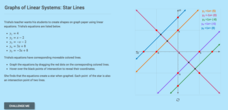
Graphs of Linear Systems: Star Lines
Let the class stars shine. Using four given linear equations, scholars create a graph of a star. The pupils use the interactive to graph the linear systems and determine the points of intersection. Through the activity, classmates...
K-5 Math Teaching Resources
Graph Paper
You'll never have to buy graph paper again with this printable resource, which can be used for anything from creating graphs, plotting points in the coordinate plane, or measuring the area and perimeter of polygons. A helpful resource...
CK-12 Foundation
Double Bar Graphs: Favorite Cookies Chart
It's just the way the cookie crumbles. Using the data from a class poll, learners create a double bar graph showing favorite cookie types. The pupils compare favorites between boys and girls with the aid of their graphs, then they make...
EngageNY
Graphing Rational Functions
Put everything together in a picture. Scholars take what they learned in the previous three lessons in the 15th segment of a 23-part unit to graph rational functions. They find the end behavior, the horizontal and vertical asymptotes if...
CK-12 Foundation
Single Bar Graphs: Hockey Teams
Raise the bar for hockey fans. Using data about favorite hockey teams, pupils build a bar graph. They use the information from the graph to make comparisons and solve one- and two-step problems.
Flipped Math
Unit 10 Review: Graphing Sine and Cosine
Go up and down with a review. Learners review finding the amplitude, midline, period, and frequency of sinusoidal functions and use that information to draw graphs. Pupils arrive at equations for function from graphs. They finish up the...
CK-12 Foundation
Quadratic Functions and Their Graphs: Soccer Ball Trajectory
Determine critical points in the flight of a soccer ball. Pupils use an interactive resource to find the vertex and x-intercepts of the graph of the trajectory of a soccer ball after being kicked. Scholars investigate the trajectory...
CK-12 Foundation
Graphs of Systems of Linear Inequalities in Two Variables: President Jefferson's Octagonal Home
Mathematically complete a set of blueprints. Using eight linear inequalities, pupils create a blueprint of Thomas Jefferson's home. Individuals graph the linear inequalities and position the solution of the inequalities before...
Other popular searches
- Coordinate Graphing Pictures
- Graphing Ordered Pairs
- Graphing Skills Lesson Plans
- Coordinate Graphing
- Graphing Linear Equations
- Holiday Coordinate Graphing
- Graphing Linear Inequalities
- Graphing Calculator
- Graphing Inequalities
- Halloween Math Graphing
- Graphing Mean, Median, Mode
- Graphing Data


