Common Core Sheets
Determining Coordinates: Graphing Patterns
Building on their prior knowledge about patterns, this series of worksheets introduces young mathematicians to graphing in the coordinate plane. Using written descriptions of different numerical patterns, learners create sets of order...
World Wildlife Fund
Bar Charts & Pie Charts
Learn about life in the Arctic while practicing how to graph and interpret data with this interdisciplinary instructional activity. Starting with a whole group data-gathering exercise, students are then given a worksheet on which they...
Illustrative Mathematics
Weather Graph Data
Teaching young mathematicians about collecting and analyzing data allows for a variety of fun and engaging activities. Here, children observe the weather every day for a month, recording their observations in the form of a bar graph....
Google
Graphing with Google Docs & Forms
Get to know your class and teach about data analysis all with the help of Google Docs. Using student-generated questions, create a class survey using Google Forms. Reserve time in the computer lab for learners to complete the form and,...
Flipped Math
Modeling with Graphs
Create a graph for anything in the world. Pupils continue to work with graphs that model situations. The learners analyze different graphs to answer questions about the scenario along with finding equations of graphs. Scholars use...
CCSS Math Activities
Vincent’s Graphs
What in the world are they doing? Given two graphs, scholars interpret the graphs and connect them to a real-world situation. They must also draw a graph given information about a context.
Mathed Up!
Drawing Quadratic Graphs
Curve through the points. The resource, created as a review for the General Certificate of Secondary Education Math test, gives scholars the opportunity to refresh their quadratic graphing skills. Pupils fill out function tables to find...
Flipped Math
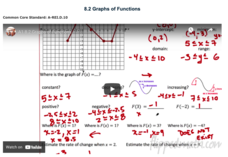
Graphs of Functions
Create a graphical description. Pupils watch a video presentation starting with vocabulary on properties of a graph of a function and then use the vocabulary to find key features of graphs of a function. Scholars use three graphs in the...
CK-12 Foundation
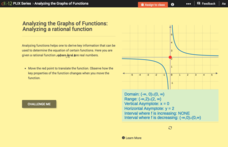
Analyzing the Graphs of Functions: Analyzing a Rational Function
Shift the function and transform the key features of the graph. By translating the graph of the rational function, class members find out how the key features alter. Pupils determine the domain, range, asymptotes, and intervals of...
Virginia Department of Education
Graphs
Examine different types of graphs as a means for analyzing data. Math scholars identify the type of graph from a series of data displays and then develop questions to match each one. Then, given a scatter plot of height versus age data,...
Inside Mathematics
Vencent's Graphs
I like algebra, but graphing is where I draw the line! Worksheet includes three multiple-part questions on interpreting and drawing line graphs. It focuses on the abstract where neither axis has numbers written in, though both are...
Charleston School District
Graphs of Linear Functions
What does a slope of 2/3 mean? Develop an understanding of the key features of a linear function. Pupils graph the linear functions and explain the meaning of the slope and intercepts of the graphs.
Willow Tree
Bar Graphs
Circles, lines, dots, boxes: graphs come in all shapes in sizes. Scholars learn how to make a bar graph using univariate data. They also analyze data using those bar graphs.
EngageNY
Graphing Quadratic Functions from Factored Form
How do you graph a quadratic function efficiently? Explore graphing quadratic functions by writing in intercept form with a lesson plan that makes a strong connection to the symmetry of the graph and its key features before individuals...
EngageNY
Exploring the Symmetry in Graphs of Quadratic Functions
Math is all about finding solutions and connections you didn't expect! Young mathematicians often first discover nonlinear patterns when graphing quadratic functions. The lesson begins with the vocabulary of a quadratic graph and uses...
EngageNY
The Graph of a Linear Equation in Two Variables Is a Line
Show your class that linear equations produce graphs of lines. The 20th segment in a unit of 33 provides proof that the graph of a two-variable linear equation is a line. Scholars graph linear equations using two points, either from...
US Department of Commerce
Looking at Numbers of Births Using a Line Graph
Was there a baby boom? Using census data, class members take a look at the number of 8-11 year olds and determine their birth years. Scholars create a double line graph to compare the number of births for two states for several years....
EngageNY
Graphing the Sine and Cosine Functions
Doing is more effective than watching. Learners use spaghetti to discover the relationship between the unit circle and the graph of the sine and cosine functions. As they measure lengths on the unit circle and transfer them to a...
EngageNY
Every Line is a Graph of a Linear Equation
Challenge the class to determine the equation of a line. The 21st part in a 33-part series begins with a proof that every line is a graph of a linear equation. Pupils use that information to find the slope-intercept form of the equation...
EngageNY
Relationships Between Quantities and Reasoning with Equations and Their Graphs
Graphing all kinds of situations in one and two variables is the focus of this detailed unit of daily lessons, teaching notes, and assessments. Learners start with piece-wise functions and work their way through setting up and solving...
Charleston School District
Graphing Functions
How do letters and numbers create a picture? Scholars learn to create input/output tables to graph functions. They graph both linear and nonlinear functions by creating tables and plotting points.
West Contra Costa Unified School District
Key Features of Graphs
The key is ... After a day of instruction on key features of graphs, groups create a poster and presentation on the key features of their given function graph. The resource provides an extension activity of "telephone" using graphs.
EngageNY
Graphing Factored Polynomials
Young mathematicians graph polynomials using the factored form. As they apply all positive leading coefficients, pupils demonstrate the relationship between the factors and the zeros of the graph.
Balanced Assessment
Multi-Graphs
So many things change as time goes by. Here, scholars create graphs based on this premise. Each problem asks pupils to sketch a graph that describes a given situation. Their graphs represent various characteristics such as height,...
Other popular searches
- Coordinate Graphing Pictures
- Graphing Ordered Pairs
- Graphing Skills Lesson Plans
- Coordinate Graphing
- Graphing Linear Equations
- Holiday Coordinate Graphing
- Graphing Linear Inequalities
- Graphing Calculator
- Graphing Inequalities
- Halloween Math Graphing
- Graphing Mean, Median, Mode
- Graphing Data


