Shodor Education Foundation
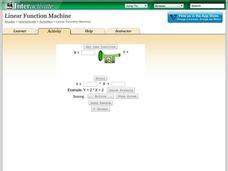
Linear Function Machine
What goes in must come out! Learners play with a function machine to determine the correct function. They enter input values and watch as the machine produces the output.
Charleston School District
Graphs of Linear Functions
What does a slope of 2/3 mean? Develop an understanding of the key features of a linear function. Pupils graph the linear functions and explain the meaning of the slope and intercepts of the graphs.
Charleston School District
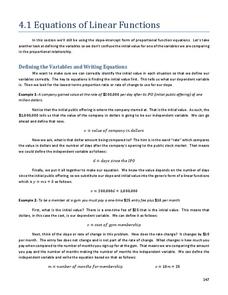
Equations of Linear Functions
Teaching linear function relationships using contextual information is beneficial to pupils' understanding. The lesson uses problem solving to build linear functions given different information for each problem. This is the second...
Charleston School District
Tables of Linear Functions
Don't forget the tables! The previous lessons in this five-part series examined the linear equation and graph relationship. The current lesson adds tables to the mix. At completion, individuals should be able to create a table of values,...
EngageNY
Comparing Linear and Exponential Models Again
Making connections between a function, table, graph, and context is an essential skill in mathematics. Focused on comparing linear and exponential relationships in all these aspects, this resource equips pupils to recognize and interpret...
EngageNY
Graphs of Functions and Equations
Explore the graphs of functions and equations with a resource that teaches scholars how to graph functions as a set of input-output points. They learn how the graph of a function is the graph of its associated equation.
Mathematics Vision Project
Module 2: Linear and Exponential Functions
Write, graph, and model all things linear and exponential. Building on the previous module in a nine-part Algebra I series, learners compare linear exponential modeling. They write equations, graph functions, and analyze key features.
Wordpress
Introduction to Exponential Functions
This lesson begins with a review of linear functions and segues nicely over its fifteen examples and problems into a deep study of exponential functions. Linear and exponential growth are compared in an investment task. Data tables are...
K20 LEARN
Didn’t We Already Learn That Pattern? Functions/Arithmetic Sequences
Just how many toothpicks does the pattern take? After watching a video of someone building a pattern with toothpicks, groups create methods to find the number of toothpicks needed to accomplish that task. Groups either use explicit...
EngageNY
Translating Graphs of Functions
If you know one, you know them all! Parent functions all handle translations the same. This instructional activity examines the quadratic, absolute value, and square root functions. Pupils discover the similarities in the behavior of the...
EngageNY
Linear Equations in Two Variables
Create tables of solutions of linear equations. A lesson has pupils determine solutions for two-variable equations using tables. The class members graph the points on a coordinate graph.
West Contra Costa Unified School District
Introduction to Inverse Functions
Ready to share the beauty of the inverse function with your classes? This algebra II lesson guides the discovery of an inverse function through a numerical, graphical, and an algebraic approach. Connections are made between the three,...
Charleston School District
Contextualizing Function Qualities
Let the graph tell the story! Adding context to graphs allows learners to analyze the key features of the function. They make conclusions about the situation based on the areas the graph is increasing, decreasing, or has a maximum...
Virginia Department of Education
Graphing Linear Equations
Combine linear equations and a little creativity to produce a work of art. Math scholars create a design as they graph a list of linear equations. Their project results in a stained glass window pattern that they color.
101 Questions
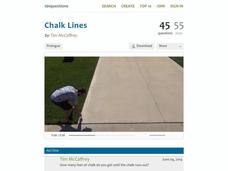
Chalk Lines
Read between the lines to find a solution. Budding mathematicians analyze a situation to solve a problem. They view a video presentation of the problem, brainstorm important information to gather, and write linear equations to find...
Mathalicious
Domino Effect
Carryout the instructional activity to determine the cost of pizza toppings from a Domino's Pizza® website while creating a linear model. Learners look through real data—and even create their own pizza—to determine the cost of each...
Mt. San Antonio Collage
Synthetic Division and Zeros of Polynomial Functions
More than just a learning exercise, this guide provides the description of many of the polynomials theorems to assist the learners. Starting with synthetic division, class members are then guided through the remainder theorem and linear...
101 Questions
Styrofoam Cups
How many cups does it take to reach the top? Learners attempt to answer this through a series of questions. They collect dimension information and apply it to creating a function. The lesson encourages various solution methods and...
Benjamin Franklin High School
Saxon Math: Algebra 2 (Section 9)
Section 9 of the 12 linked Saxon Math sections introduces the young algebrist to graphing periodic functions, creating graphs from quadratic roots, working with inequalities, and rational equations. Common among all the lessons is the...
Virginia Department of Education
Transformation Investigation
Graph it! Investigate transformations with a graphing calculator. Pupils graph sets of linear functions on the same set of axes. They determine how changes in the equation of a linear function result in changes in the graph.
Mathematics Vision Project
Module 3: Polynomial Functions
An informative module highlights eight polynomial concepts. Learners work with polynomial functions, expressions, and equations through graphing, simplifying, and solving.
Mathematics Vision Project
Quadratic Functions
Inquiry-based learning and investigations form the basis of a deep understanding of quadratic functions in a very thorough unit plan. Learners develop recursive and closed methods for representing real-life situations,...
Virginia Department of Education
Matching Representations
Pupils explore the many representations of linear functions by completing a matching activity to connect the multiple representations of a function. They then reinforce the connection as individuals create the different representations...
02 x 02 Worksheets
Inverse Variation
Discover an inverse variation pattern. A simple lesson plan design allows learners to explore a nonlinear pattern. Scholars analyze a distance, speed, and time relationship through tables and graphs. Eventually, they write an equation to...


