GeoGebra
GeoGebra Graphing Calculator
So, exactly, what does it look like? The easily usable graphing calculator allows pupils to visualize the graph of equations and inequalities. The interactive supports any algebraic graph needed for high school mathematics and then some.
Radford University
How to Calculate and Analyze the Equation for a Parabolic Path
Working in groups, pupils plot three points on the coordinate plane representing three different parabolic paths. Using a calculator, they determine the quadratic regression equation for their models. Each team then figures out the...
Making Math More Fun
Making Math More Fun
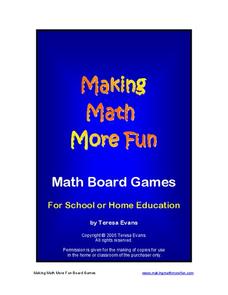
Address fundamental math skills with a series of fun math board games. With 25 games that focus on addition, subtraction, multiplication, division, place value, and percentages, kids will quickly find that math practice is their favorite...
Curated OER
Making Math More Fun
Trick young mathematicians into practicing their basic arithmetic with this extensive collection of fun math games. Whether you're teaching addition, subtraction, multiplication, division, place value, or even fractions, there is a...
Buffalo State
A Five Day Approach to Using Technology and Manipulatives to Explore Area and Perimeter
Young mathematicians build an understanding of area and perimeter with their own two hands in a series of interactive geometry lessons. Through the use of different math manipulatives, children investigate the properties of...
EngageNY
Making Scale Drawings Using the Ratio Method
Is that drawn to scale? Capture the artistry of geometry using the ratio method to create dilations. Mathematicians use a center and ratio to create a scaled drawing. They then use a ruler and protractor to verify measurements.
University of Missouri
Money Math
Young mathematicians put their skills to the test in the real world during this four-lesson consumer math unit. Whether they are learning how compound interest can make them millionaires, calculating the cost of remodeling...
Statistics Education Web
It Creeps. It Crawls. Watch Out For The Blob!
How do you find the area of an irregular shape? Class members calculate the area of an irregular shape by finding the area of a random sampling of the shape. Individuals then utilize a confidence interval to improve accuracy and use a...
Big Kid Science
Measuring Shadows Using an Ancient Method
How did ancient peoples determine the height of really tall objects? Young scientists and mathematicians explore the concept of using shadows to measure height in a hands-on experiment. Paired pupils measure shadows, then calculate the...
EngageNY
Modeling Riverbeds with Polynomials (part 1)
Many things in life take the shape of a polynomial curve. Learners design a polynomial function to model a riverbed. Using different strategies, they find the flow rate through the river.
Partnership for Educating Colorado Students
Mayan Mathematics and Architecture
Take young scholars on a trip through history with this unit on the mathematics and architecture of the Mayan civilization. Starting with a introduction to their base twenty number system and the symbols they used, this eight-lesson unit...
EngageNY
Graphs of Quadratic Functions
How high is too high for a belly flop? Learners analyze data to model the world record belly flop using a quadratic equation. They create a graph and analyze the key features and apply them to the context of the video.
Mrs. Burke's Math Page
Let Them Eat Pi
Looking for a fun and creative way to celebrate Pi Day? Then this is the resource for you. From a scavenger hunt and trivia contest to PowerPoint presentations and skills practice worksheets, this collection of materials is a...
National Security Agency
It's Probably Probable
Learners make predictions and draw conclusions from given information as they learn the meaning of probability in this vocabulary-rich, integrated activity that presents a variety of teaching strategies to motivate and reach...
Curated OER
All About Money
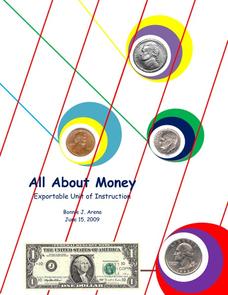
Few topics engage young mathematicians as much as learning about money. Through a series of shared readings and hands-on activities, children explore the US currency system, learning how to count money and calculate change as they create...
Mascil Project
Sports Physiology and Statistics
If I want to build up my heart, where should I start? Science scholars use statistics in a sports physiology setting during an insightful experiment. Groups measure resting and active heart rates and develop a scatter plot that shows the...
Virginia Department of Education
Surface Area and Volume
Partners use materials to wrap three-dimensional objects to determine the formula for surface area. The groups use an orange to calculate the amount of peel it takes to completely cover the fruit. Using manipulatives, individuals then...
Virginia Department of Education
Exploring 3-D Geometry
Take young mathematicians on an exploration of the world of 3-D geometry with this seven-lesson unit. After first defining the terms perimeter, area, and volume and how they apply to the real world, students continue on...
Kenan Fellows
Man vs. Beast: Approximating Derivatives using Human and Animal Movement
What does dropping a ball look like as a graph? An engaging activity asks learners to record a video of dropping a ball and uploading the video to software for analysis. They compare the position of the ball to time and calculate the...
Virginia Department of Education
Going the Distance
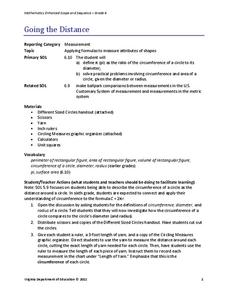
Estimate the value of one of the most famous irrational numbers. The hands-on lesson instructs classmates to measure the circumference and diameters of circles using yarn. The ratio of these quantities defines pi.
Radford University
Are You Faster than Bacteria?
Just how fast does bacteria grow? Over the course of three lessons, pupils investigate exponential growth with the use of bacteria growth. During the lesson, bacteria from a cell phone is grown to make a connection to real life. Using...
Radford University
How do I Create a Scaled Model of a Full-Sized Basketball Court?
Take mathematics to the hoop! Pairs first measure the linear distances on a basketball court. Using those measurements, they determine the scale lengths to create a scaled model. To finish the activity, learners create models of the...
PBS
Adventures With The Fish Pond: Population Modeling
Build up from the previous activity where your learners charted the population growth and decay of a fish pond with M&Ms®. Have them look at the data from that activity and create a Now-Next, or recursive equations, to predict the...
Statistics Education Web
What Percent of the Continental US is Within One Mile of a Road?
There are places in the US where a road cannot be found for miles! The lesson asks learners to use random longitude and latitude coordinates within the US to collect data. They then determine the sample proportion and confidence interval...


