GeoGebra
GeoGebra Graphing Calculator
So, exactly, what does it look like? The easily usable graphing calculator allows pupils to visualize the graph of equations and inequalities. The interactive supports any algebraic graph needed for high school mathematics and then some.
Shasta County Office of Education
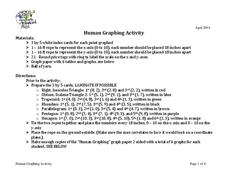
Human Graphing Activity
Take graphing outside and make a giant coordinate plane to plot your human points. Young graphers are each given a coordinate for a particular shape and asked to make the geometrical shapes one by one. Those not plotted are to write down...
K-5 Math Teaching Resources
Blank Bar Graph Template
This template is just begging for your young mathematicians to fill it in with colorful bar graphs! With horizontal and vertical axes in place and grid lines for added support, this is a great resource for teaching children how to...
World Wildlife Fund
Bar Charts & Pie Charts
Learn about life in the Arctic while practicing how to graph and interpret data with this interdisciplinary lesson. Starting with a whole group data-gathering exercise, students are then given a worksheet on which they analyze and create...
Kenan Fellows
Reading Airline Maintenance Graphs
Airline mechanics must be precise, or the consequences could be deadly. Their target ranges alter with changes in temperature and pressure. When preparing an airplane for flight, you must read a maintenance graph. The second lesson of...
Illustrative Mathematics
Weather Graph Data
Teaching young mathematicians about collecting and analyzing data allows for a variety of fun and engaging activities. Here, children observe the weather every day for a month, recording their observations in the form of a bar graph....
EngageNY
Relationships Between Quantities and Reasoning with Equations and Their Graphs
Graphing all kinds of situations in one and two variables is the focus of this detailed unit of daily lessons, teaching notes, and assessments. Learners start with piece-wise functions and work their way through setting up and solving...
EngageNY
Graphs of Quadratic Functions
How high is too high for a belly flop? Learners analyze data to model the world record belly flop using a quadratic equation. They create a graph and analyze the key features and apply them to the context of the video.
K-5 Math Teaching Resources
Graph Paper
You'll never have to buy graph paper again with this printable resource, which can be used for anything from creating graphs, plotting points in the coordinate plane, or measuring the area and perimeter of polygons. A helpful resource...
Heidi Songs
Zoo Animal Probability Graph
Capture the engagement of your young mathematicians with a collaborative graphing activity. Using a deck of zoo animal picture cards, students select a picture from the deck, record the chosen animal on a graph, and then replace the card...
Curated OER
Drive the Data Derby
Three days of race car design and driving through the classroom while guessing probability could be a third graders dream. Learn to record car speed, distances traveled, and statistics by using calculation ranges using the mean, median,...
National Security Agency
Going Green with Graphs
In this unit designed for second graders, youngsters are introduced to conducting surveys and creating tally charts based on the data they gather. Students then construct bar graphs, and observe the relationships between the two types of...
Ohio Literacy Resource Center
Solving Systems of Linear Equations Graphing
Do you need to graph lines to see the point? A thorough lesson plan provides comprehensive instruction focused on solving systems of equations by graphing. Resources include guided practice worksheet, skill practice worksheet, and an...
West Contra Costa Unified School District
Graphing Linear Inequalities Sort
Learners first determine the slope-intercept and standard forms of inequalities given graphs, and then determine key features of the graphs.
Wise Owl Factory
Mother's Day Graphing
A Mother's Day-themed math activity reinforces counting and graphing. Scholars count pictures and roll a festive die then graph their findings using a bar graph.
Columbus City Schools
Speed Racers
Who wants to go fast? The answer? Your sixth-grade science superstars! The complete resource offers the ultimate, all-inclusive playbook for mastering the important concepts of speed versus time; distance versus time; and how to graph...
Teach Engineering
Matching the Motion
It is not always easy to walk the straight and narrow. In the sixth portion of a nine-part unit, groups actively recreate a graph depicting motion. Individuals walk toward or away from a motion detector while trying to match a given...
Teach Engineering
Start Networking!
Class members create their own social networks by collecting signatures before graphing the interactions with their fellow classmates. The degree distribution of the simulated social network is determined by calculating the degree of...
National Math + Science Initative
Using Linear Equations to Define Geometric Solids
Making the transition from two-dimensional shapes to three-dimensional solids can be difficult for many geometry high schoolers. This comprehensive Common Core lesson plan starts with writing and graphing linear equations to define a...
West Contra Costa Unified School District
Graphing Systems
Get hands on with solving systems of equations graphically. A solid lesson plan uses guided practice to show how to solve systems of linear equations. It allows time for sharing ideas and provides a printable matching activity to promote...
Curated OER
Are You Full of Hot Air?
Explore the concept of measuring and recording circumference. In this physical science and measurement lesson plan, young learners blow up balloons, measure the circumference, and record the data on an interactive graphing website.
Illustrative Mathematics
Chocolate Bar Sales
In this real-world example, algebra learners start to get a sense of how to represent the relationship between two variables in different ways. They start by looking at a partial table of values that define a linear relationship. They...
Berkshire Museum
Camouflage!: Collecting Data and Concealing Color
Help young scholars see the important role camouflage plays in the survival of animals with a fun science lesson. Starting with an outdoor activity, children take on the role of hungry birds as they search for worms represented by...
Baylor College
Living Things and Their Needs: The Math Link
Enrich your study of living things with these cross-curricular math activities. Following along with the story Tillena Lou's Day in the Sun, learners will practice addition and subtraction, learn how to measure volume and length, work on...
Other popular searches
- Coordinate Graphing Pictures
- Graphing Ordered Pairs
- Graphing Skills Lesson Plans
- Coordinate Graphing
- Graphing Linear Equations
- Holiday Coordinate Graphing
- Graphing Linear Inequalities
- Graphing Calculator
- Graphing Inequalities
- Halloween Math Graphing
- Graphing Mean, Median, Mode
- Graphing Data


