EngageNY
Real-World Positive and Negative Numbers and Zero II
Continuing from the previous lesson in the series, scholars learn to use positive and negative integers to describe real-world situations. In groups, they come up with their own situations for given positive and negative integers.
EngageNY
Real-World Positive and Negative Numbers and Zero
Class members investigate how positive and negative numbers are useful in the real world. Individuals first read a short passage and identify terms indicating positive and negative numbers. They consider situations involving positive...
EngageNY
Writing and Graphing Inequalities in Real-World Problems
Inequalities: when one solution just doesn't suffice. Individuals learn to write inequalities in real-world contexts and graph solution sets on the number line. All inequalities in the instructional activity are of the form x < c or x...
EngageNY
Multi-Step Problems in the Real World
Connect graphs, equations, and tables for real-world problems. Young mathematicians analyze relationships to identify independent and dependent variables. These identifications help create tables and graphs for each situation.
EngageNY
Revisiting the Graphs of the Trigonometric Functions
Use the graphs of the trigonometric functions to set the stage to inverse functions. The lesson reviews the graphs of the basic trigonometric functions and their transformations. Pupils use their knowledge of graphing functions to model...
Annenberg Foundation
Skeeters Are Overrunning the World
Skeeters are used to model linear and exponential population growth in a wonderfully organized lesson plan including teachers' and students' notes, an assignment, graphs, tables, and equations. Filled with constant deep-reaching...
EngageNY
Comparing Linear Functions and Graphs
How can you compare linear functions? The seventh installment of a 12-part module teaches learners how to compare linear functions whose representations are given in different ways. They use real-world functions and interpret features in...
Howard Hughes Medical Institute
Spreadsheet Tutorial 3: Column Graphs, Error Bars, and Standard Error of the Mean
There's absolutely no error in using the tutorial! Learners use spreadsheets to create column or bar graphs with error bars. They also learn how to calculate the standard error of the mean in the tutorial. This is the third installment...
Flipped Math
Create and Analyze Graphs
Model the world with graphs. Pupils watch and participate in creating graphs to model real-world situations. The presenters stress the importance of a consistent scale and proper labels for the graphs along with identification of the...
Radford University
Transformational Graphing in the Real World: Bacteria – Growth or Decay?
Grow—not decay—your knowledge of exponential functions. Young mathematicians graph exponential functions and explore how transformations affect the graphs. They decide whether the functions represent growth or decay in the context of...
Virginia Department of Education
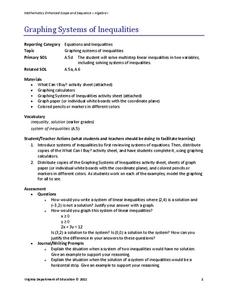
Graphing Systems of Inequalities
Apply systems of inequalities to a real-world problem. Here, scholars learn to graph solutions to systems of linear inequalities. To finish the instructional activity, they solve a problem involving burgers and cheeseburgers using a...
Illustrative Mathematics
Logistic Growth Model, Abstract Version
Here learners get to flex some serious algebraic muscles through an investigation of logistic growth. The properties of the constant terms in the logistic growth formula are unraveled in a short but content-dense activity. Moving...
Radford University
Transformational Graphing in the Real World: Building Bridges
No suspension here, the resource is good to go. Using graphing calculators, scholars explore how transformations affect the graphs of quadratic functions. They consider how the changes relate to the context of suspension bridges.
Radford University
Transformational Graphing in the Real World: Air Traffic Control
You're cleared to learn about absolute value functions. An interesting lesson has scholars investigate transformations of the graphs of absolute value functions. They look at air traffic control as an application of the concept.
NASA
Cloudy vs. Clear - Graphs
Explore the link between solar energy and cloud cover using real data from NASA from China! Future climatologists analyze and interpret graphs of solar energy on clear and cloudy days using a literacy cube. Investigators draw conclusions...
CK-12 Foundation
Graphs of Absolute Value Equations: Absolute Value Distance
The sole purpose of this interactive is to graph a function representing the distance of a car from a shoe store. Scholars use an interactive to graph such an absolute value function. They then answer a set of challenge questions...
North Carolina State University
Exploring Genetics Across the Middle School Science and Math Curricula
Where is a geneticist's favorite place to swim? A gene pool. Young geneticists complete hands-on activities, experiments, and real-world problem solving throughout the unit. With extra focus on dominant and recessive genes, Punnett...
Baylor College
Living Things and Their Needs: The Math Link
Enrich your study of living things with these cross-curricular math activities. Following along with the story Tillena Lou's Day in the Sun, learners will practice addition and subtraction, learn how to measure volume and length, work on...
EngageNY
Modeling Linear Relationships
Math modeling is made easy with the first installment of a 16-part module that teaches pupils to model real-world situations as linear relationships. They create graphs, tables of values, and equations given verbal descriptions.
Council for Economic Education
The Economics of Income: If You’re So Smart, Why Aren't You Rich?
If basketball players make more than teachers, why shouldn't learners all aspire to play in the NBA? Unraveling the cost and benefits of education and future economic success can be tricky. Economic data, real-life cases, and some...
NASA
Geographical Influences
"If global warming is real, why is it so cold?" Distinguishing the difference between weather and climate is important when it comes to understanding our planet. In these activities, young scientists look at the climate patterns in a...
Illustrative Mathematics
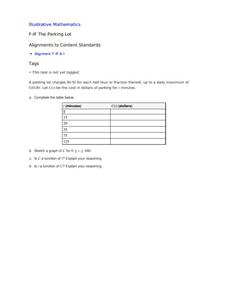
The Parking Lot
Use the real-world cost of parking a car to demonstrate the properties of a function. The resource describes to learners how much it is to park in a certain lot. It is up to your number crunchers to complete a table of minutes and...
EngageNY
Increasing and Decreasing Functions 2
Explore linear and nonlinear models to help your class build their function skills. In a continuation of the previous lesson, learners continue to analyze and sketch functions that model real-world situations. They progress from linear...
Illustrative Mathematics
US Garbage, Version 1
An interesting example of a discrete function and how it is applies to the real world. This could easily make a good collaborative lesson with an environmental science class. Practice reading a table and drawing a scatter plot make up...


