K-5 Math Teaching Resources
Number Lines 0-20
Need a number line? Here are four number lines ranging from zero to twenty.
EngageNY
Every Line is a Graph of a Linear Equation
Challenge the class to determine the equation of a line. The 21st part in a 33-part series begins with a proof that every line is a graph of a linear equation. Pupils use that information to find the slope-intercept form of the...
EngageNY
Real-World Positive and Negative Numbers and Zero
Class members investigate how positive and negative numbers are useful in the real world. Individuals first read a short passage and identify terms indicating positive and negative numbers. They consider situations involving positive...
West Contra Costa Unified School District
Subtracting Numbers
Give families the information needed to support their child in the mastering of subtracting numbers with a two page reference sheet offering detailed descriptions and labeled examples.
Cornell University
Constructing and Visualizing Topographic Profiles
Militaries throughout history have used topography information to plan strategies, yet many pupils today don't understand it. Scholars use Legos and a contour gauge to understand how to construct and visualize topographic profiles. This...
Homeschool Creations
Skip Counting
Young mathematicians hop, skip, and jump their way to a deeper number sense with the help of these printable handouts.
University of Utah
Rational and Irrational Numbers
Conquer any irrational fears you might have of irrational numbers. As class members investigate how to represent numbers geometrically, they learn about rational and irrational numbers, including approximating and ordering rational...
Willow Tree
Bar Graphs
Circles, lines, dots, boxes: graphs come in all shapes in sizes. Scholars learn how to make a bar graph using univariate data. They also analyze data using those bar graphs.
Mathed Up!
Frequency Polygons
Frequency polygons are a different way to represent frequencies over intervals. Pupils take frequencies for intervals of data from a frequency table and plot them as a frequency polygon. Budding mathematicians find information about the...
Virginia Department of Education
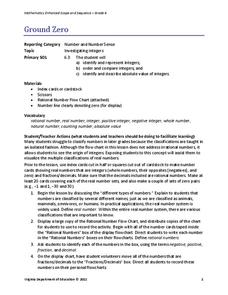
Ground Zero
Don't harbor any negative feelings toward negative numbers. Scholars learn about different classifications of rational numbers, including negative integers. They also develop definitions of the opposite and the absolute value of a...
Virginia Department of Education
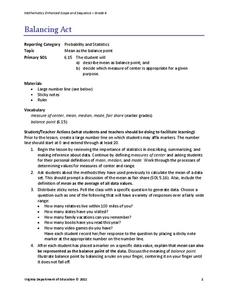
Balancing Act
How many different interpretations of the mean are there? Scholars place numbers on a number line and determine the mean. They interpret the mean as the average value and as the balance point.
Benjamin Franklin High School
Saxon Math: Algebra 2 (Section 4)
This fourth of twelve units in a series continues the investigation of functions through equations and inequalities. However, the modular nature of the lessons in the section make this an excellent resource for any curriculum...
Curated OER
Simple Harmonic Motion
Back and forth, and back again. A presentation on harmonic motion would make a great backdrop for a directed instruction lesson in Honors Physics. It includes diagrams, formulas, graphs, and a few sample problems.
CCSS Math Activities
Smarter Balanced Sample Items: 6th Grade Math – Claim 4
Develop a model for prep. The resource provides examples of how items reflect modeling and data analysis for Smarter Balanced assessments. Items use on-grade or below-grade content to focus on the modeling aspect. The questions revolve...
EngageNY
Drawing the Coordinate Plane and Points on the Plane
To plot a point in the coordinate plane, you first need a coordinate plane. Pupils learn to draw an appropriate set of axes with labels on a coordinate plane. They must also determine a reasonable scale to plot given coordinate pairs on...
EngageNY
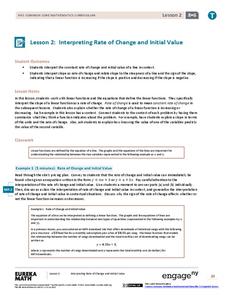
Interpreting Rate of Change and Initial Value
Building on knowledge from the previous lesson, the second lesson in this unit teaches scholars to identify and interpret rate of change and initial value of a linear function in context. They investigate how slope expresses the...
West Contra Costa Unified School District
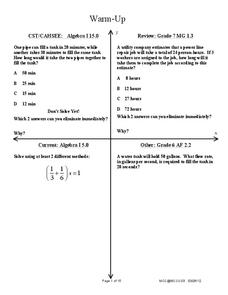
Work Problems – Bar Models
Why do we have to do so much work? Scholars learn how to set up bar models to represent a situation involving work. They use these bar models to help set up equations with rational coefficients to solve the problem situation.
MLC
Fractions Packet
Your fifth graders will appreciate the simple, direct explanations, examples, and practice exercises in this well-organized unit on fractions. Beginning with an introduction to fractions, the packet flows smoothly through the fraction...
Curated OER
Acceleration
Speed up the class's understanding of acceleration with a presentation! The resource includes a definition, example problems, acceleration due to gravity, and a graphical representation of acceleration.
EngageNY
Congruence, Proof, and Constructions
This amazingly extensive unit covers a wealth of geometric ground, ranging from constructions to angle properties, triangle theorems, rigid transformations, and fundamentals of formal proofs. Each of the almost-forty lessons...
West Contra Costa Unified School District
Solving a System by Substitution
Solving systems by substitution can be a challenging topic in algebra I. Here is a lesson that builds on learners' understanding of intercepts to begin the process of substitution, and all work is reinforced graphically to build...
Illustrative Mathematics
Computing Volume Progression 2
Once your geometers know how to apply the formula V = l w h, they will be ready to take on the fractional volume of a fish tank. Have your number crunchers swap heights so they can see that the fractional volume will not change.
National Research Center for Career and Technical Education
Depreciation (Double Declining)
Have you ever been told that your new car begins to lose its value as soon as you drive it off the lot? Aspiring accountants take on the concepts of depreciation and book value through an easy-to-deliver career and technology lesson. The...
Willow Tree
Box-and-Whisker Plots
Whiskers are not just for cats! Pupils create box-and-whisker plots from given data sets. They analyze the data using the graphs as their guide.


