Columbus City Schools
Speed Racers
Who wants to go fast? The answer? Your sixth-grade science superstars! The complete resource offers the ultimate, all-inclusive playbook for mastering the important concepts of speed versus time; distance versus time; and how to graph...
American Statistical Association
What Fits?
The bounce of a golf ball changes the result in golf, mini golf—and a great math activity. Scholars graph the height of golf ball bounces before finding a line of best fit. They analyze their own data and the results of others to better...
CK-12 Foundation
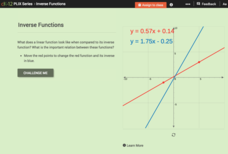
Inverse Functions
Provide a graphical view of inverses. Pupils manipulate points on a line and see the relationship of the graph with the graph of its inverse. Using the relationship between the graphs, scholars respond to questions concerning inverses...
Teach Engineering
Mechanics of Elastic Solids
Make the connection between Hooke's law and elasticity with an activity that introduces the class to the behavior of elastic materials. The resource defines stress and strain to calculate the modules of elasticity of materials and also...
EngageNY
The Slope of a Non-Vertical Line
This lesson introduces the idea of slope and defines it as a numerical measurement of the steepness of a line. Pupils then use the definition to compare lines, find positive and negative slopes, and notice their definition holds for...
EngageNY
The Computation of the Slope of a Non-Vertical Line
Determine the slope when the unit rate is difficult to see. The 17th part of a 33-part series presents a situation that calls for a method to calculate the slope for any two points. It provides examples when the slope is hard to...
Shodor Education Foundation
InteGreat
Hands-on investigation of Riemann sums becomes possible without intensive arithmetic gymnastics with this interactive lesson plan. Learners manipulate online graphing tools to develop and test theories about right, left, and midpoint...
Virginia Department of Education
Calculating Measures of Dispersion
Double the fun — calculate two measures of deviation. The lesson plan provides information to lead the class through the process of calculating the mean absolute deviation and the standard deviation of a data set. After learning how to...
EngageNY
When Can We Reverse a Transformation? 1
Wait, let's start over — teach your class how to return to the beginning. The first lesson looking at inverse matrices introduces the concept of being able to undo a matrix transformation. Learners work with matrices with a determinant...
National Research Center for Career and Technical Education
Break-Even Point
How do companies determine the prices of their products? Marketing maestros discover the concepts of cost and break-even point through discussion, independent practice, and a collaborative assessment. The career and technology-oriented...
Council for Economic Education
FRED and the Federal Budget Interactive Lesson
How can a federal debt accumulate over time? The Federal Reserve Economic Data (FRED) dashboard allows scholars to actively research each aspect of the federal budget. In pairs, they analyze economic data to determine the best way to...
Mr. E. Science
Motion
An informative presentation covers motion, metric system, conversions, graphing of coordinates and lines, speed, velocity, and acceleration problems, as well as mean calculations. This is the first lesson in a 26-part series.
EngageNY
The Binomial Theorem
Sometimes, there is a better way. Scholars develop Pascal's triangle as a method to arrive at the coefficients of binomial expansions as an easier method to expand binomials. The learners connect the formula for binomial coefficients to...
Discovery Education
Sonar & Echolocation
A well-designed, comprehensive, and attractive slide show supports direct instruction on how sonar and echolocation work. Contained within the slides are links to interactive websites and instructions for using apps on a mobile device to...
Willow Tree
Slope
Investigate the different types of slope using graphs and ordered pairs. Scholars use the slope formula to determine the slope of a line between two points. Includes examples with a slope of zero and with no slope. The instructional...
EngageNY
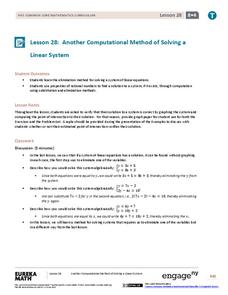
Another Computational Model of Solving a Linear System
The process of elimination really works! Use elimination when substitution isn't doing the job. The 29th segment in a series of 33 introduces the elimination method to solving linear systems. Pupils work several exercises to grasp the...
Ed Migliore
Linear Equations in Two Variables
This traditional textbook style unit includes vocabulary, a direct explanation section, examples, practice problems that directly line up with the explanations and examples, and a unit summary review and practice problems. Learners get...
Benjamin Franklin High School
Saxon Math: Algebra 2 (Section 4)
This fourth of twelve units in a series continues the investigation of functions through equations and inequalities. However, the modular nature of the lessons in the section make this an excellent resource for any curriculum covering...
Bowels Physics
Electric Circuits
Investigate the construction of the electric circuit with a thorough presentation that provides a solid background for each type of circuit. After introducing key vocabulary, the lesson goes on to explain circuit design.
EngageNY
Interpreting Correlation
Is 0.56 stronger than -0.78? Interpret the correlation coefficient as the strength and direction of a linear relationship between two variables. An algebra lesson introduces the correlation coefficient by estimating and then calculating it.
Mathed Up!
Scatter Graphs
Make an estimate by getting in line. The class works with scatter plots and lines of best fit to make an estimate for given values. Pupils determine whether there is a positive or negative correlation and draw a best-fit line. Using the...
Flipped Math
Correlation
Determine how close the line is to the scatter plot. Clear video instruction shows how to plot a scatter plot and find the best fit line using the linear regression function on a calculator. Pupils use the information from the calculator...
CK-12 Foundation
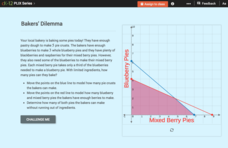
Linear Programming: Bakers' Dilemma
Place the pies in a line. Pupils create a graph of a system of linear inequalities to represent the number of pies a bakery can make. Learners analyze the vertices on the graph to determine the number of pies they can bake without...
Virginia Department of Education
Numbers in a Name
What's in a name? Pupils create a data set from the number of letters in the names of classmates. Each group then takes the data and creates a visual representation, such as a histogram, circle graph, stem-and-leaf plot, etc.


