Wordpress
Introduction to Exponential Functions
This lesson begins with a review of linear functions and segues nicely over its fifteen examples and problems into a deep study of exponential functions. Linear and exponential growth are compared in an investment task. Data tables are...
Annenberg Foundation
Skeeters Are Overrunning the World
Skeeters are used to model linear and exponential population growth in a wonderfully organized lesson plan including teachers' and students' notes, an assignment, graphs, tables, and equations. Filled with constant deep-reaching...
NASA
Geographical Influences
"If global warming is real, why is it so cold?" Distinguishing the difference between weather and climate is important when it comes to understanding our planet. In these activities, young scientists look at the climate patterns in a...
Utah Education Network (UEN)
Finding Slope of a Line from Graphs, Tables, and Ordered Pairs
Middle schoolers explore the concept of slope in numerous ways and start to look at simple linear equations. They describe the slope in a variety of ways such as the steepness of a line, developing a ratio, using graphs, using similar...
Illustrative Mathematics
Puppy Weights
Nobody can say no to puppies, so lets use them in math! Your learners will take puppy birth weights and organize them into different graphs. They can do a variety of different graphs and detail into the problem based on your classroom...
Curated OER
Graphing Inequalities in Two Variables
This study guide is a great resource to help you present the steps to graphing linear inequalities. Show your class two different ways to graph an inequality and work on a real-world example together. The document could also be easily...
Curated OER
Mathemafish Population
It's shark week! In this problem, young mathematically minded marine biologists need to study the fish population by analyzing data over time. The emphasis is on understanding the average rate of change of the population and drawing...
Illustrative Mathematics
Electoral College
A cross-curricular resource that takes the electoral votes and allows your learners to organize and analyze the data. Young voters can determine which states are more influential and interpret the dotplot provided for more data....
Curated OER
Access Ramp
Just about every public building that your students are familiar with has an access ramp which complies with ADA requirements. As it turns out, designing such a ramp is an excellent activity to incorporate slope, the Pythagorean Theorem,...
Chicago Botanic Garden
GEEBITT (Global Equilibrium Energy Balance Interactive TinkerToy)
Students use the GEEBITT excel model to explore how global average temperatures are affected by changes in our atmosphere in part two of this series of seven lessons. Working in groups, they discuss, analyze graphs, and enter data to...
Curated OER
Can You Measure Up?
Here is a well-designed lesson on common standards of measurement for your young mathematicians. In it, learners calculate measurements in standard and non-standard units. They make predictions, record data, and construct and design...
California Academy of Science
How Big is Big?
In a math or life science class, "mini-me" models are created with cardstock to reflect a 1:10 scale of students' bodies. Learners measure each others' heights with meter sticks, and then reduce the size by 10. After this exercise, they...
National Security Agency
It's Probably Probable
Learners make predictions and draw conclusions from given information as they learn the meaning of probability in this vocabulary-rich, integrated activity that presents a variety of teaching strategies to motivate and reach all learning...
Curated OER
Weighted Averages
Weighted averages can be tricky to explain! However, this study guide makes it easy for teachers by including definitions, explanations, and breaking down problems into three steps. Includes mixture problems and uniform motion problems.
Council for Economic Education
Production Possibilities Curve
Demonstrate the important economic principles of the production possibilities curve, including how to calculate opportunity cost and graph curves by using a table or calculation. Learners use a variety of methods, including videos,...
Education Institute
Four Mathematics Lessons for Grade 9
These four lesson plans build algebra skills for working with numbers in exponential form and for examining triangles. Be aware that in the text, scientific notation is referred to as index notation and the laws of exponents as the laws...
Curated OER
As a Matter of Fact
Elementary-aged scientists discover that all matter has mass. They are shown the difference between mass and weight, and learn how to calculate mass using the appropriate tools and methods. The scientific method is used while estimating...
Curated OER
Writing Linear Equations in Different Forms
Can your class write linear equations three different ways? Here is a study guide that includes slope-intercept, standard, and point-slope forms. Learners are given the slope and a point on the line, or two points and are asked to write...
Curated OER
Basketball Bounces, Assessment Variation 2
This un-scaffold summative assessment tasks learners to use the height of a bouncing basketball, given the data in graph and table form, to choose the model that is represented. Learners then use the model to answer questions about the...
Mathematics Vision Project
Quadratic Functions
Inquiry-based learning and investigations form the basis of a deep understanding of quadratic functions in a very thorough unit plan. Learners develop recursive and closed methods for representing real-life situations, then apply these...
National Council of Teachers of Mathematics
National Debt and Wars
Take a functional approach to the national debt. Learners collect information about the national debt by decade and plot the data. They determine whether an exponential curve is a good fit for the data by comparing the percent changes...
Center for Innovation in Mathematics Teaching
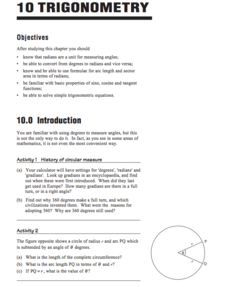
Trigonometry
This unit covers the basic trigonometry including understanding radians, how to convert between radians and degrees, the area of a circle subtended by an angle, basic properties and graphs of sine, cosine, tangent, and solving...
Population Connection
The Peopling of Our Planet
How many people live on the planet, anyway? The first resource in a six-part series covers the topic of the world population. Scholars work in groups to conduct research and make population posters after learning about the global...
Curated OER
Is That Measurement Stuff For Real, Life?
Fifth and sixth graders engage in a series of activities which show them the importance of using different types of measurement strategies. One of the primary goals of the lesson is to show learners that measurement is helpful in many...


