Curated OER
Tides - The Ins and Outs of Tides
Get your junior oceanographers to generate tidal prediction graphs on an interactive website. They will feel like experts in the field, or shall we say, experts in the ocean! This is a brief, but worthwhile activity that could be used to...
Curated OER
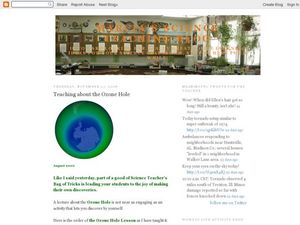
Teaching About the Ozone Hole
A PowerPoint and an accompanying worksheet introduce young meteorologists to the hole in the ozone layer. Another handout provides a coloring and graphing activity which examines the changes in the ozone. There are also links to neat...
Illustrative Mathematics
Security Camera
A different-than-normal problem that allows learners to practice their reasoning to find an answer. The problem bases itself off a graph drawing of a store that needs to install security cameras. The challenge is to find which placement...
Illustrative Mathematics
Half of a Recipe
Kids love to cook! What is a better place to learn mixed numbers than with a recipe? It is up to learners to decide how they want to divide this recipe in half. They may choose to model the mixed number and then divide the model by two....
Texas State Energy Conservation Office
Investigation: Water Wheel
Middle school scientists construct a working water wheel from an aluminum pie pan. Because of the sharp edges on the cut aluminum, this activity is for mature learners only. You could have your class compete to see whose wheel can lift...
Texas State Energy Conservation Office
Investigation: Building a Parabolic-Trough Collector
Amateurs of alternative energy build a mini parabolic-trough solar energy collector and use it to heat water. Temperature is recorded over a three-minute period and the data is graphed and analyzed. Note that in order to paint aquarium...
Curated OER
Basketball Bounces, Assessment Variation 1
This highly scaffolded, summative assessment tasks learners to choose the model that represents the height of a bouncing basketball given the data in graph and table form. Learners then use the model to answer questions about the...
Virginia Department of Education
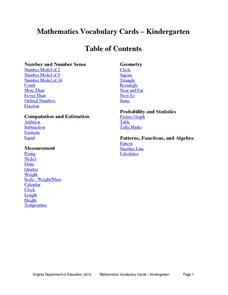
Mathematics Vocabulary Cards - Kindergarten
Enhance your math lesson with a series of pictures that illustrate different math concepts. The vocabulary includes a variety of ideas and pictures including fractions, ordinal numbers, picture graphs, and number lines.
NOAA
Subduction Zones
Sink into an interactive learning experience about subduction zones! Junior oceanographers examine the earth-shaking and earth-making effects of subduction in the fourth installment in a 13-part series. Hands-on activities include...
Howard Hughes Medical Institute
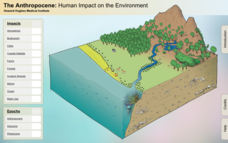
The Anthropocene: Human Impact on the Environment
Will human existence define an epoch? Many scientists think we are in a new epoch, the anthropocene, defined by humans and our impact on the environment. An online interactive demonstrates the immense impact humans have had on every part...
NASA
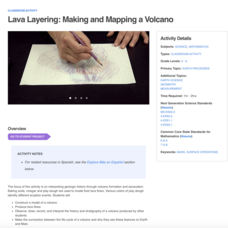
Lava Layering: Making and Mapping a Volcano
Looking for an out-of-this-world volcanic activity? Geologists study Earth's volcanic history and the neighboring planet Mars by modeling volcanic eruptions, lava flows, and building a shield volcano. Participants use graph paper and...
Curated OER
Mathemafish Population
It's shark week! In this problem, young mathematically minded marine biologists need to study the fish population by analyzing data over time. The emphasis is on understanding the average rate of change of the population and drawing...
Illustrative Mathematics
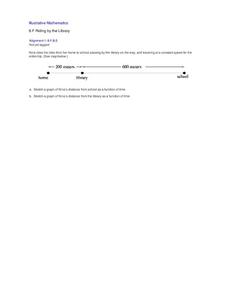
Riding by the Library
Draw a graph that shows the qualitative features of a function that has been described verbally. Make sure learners understand where time is zero and the distance is zero. It may take them some time to understand this concept, so working...
Curated OER
Weather, Weather, Everywhere!
Sixth graders collect weather data to compare temperatures around the world. Using the Internet, learners collect data, put it into spreadsheets, and analyze and graph the results. An interesting way to cover the topic of weather.
Curated OER
Mmm, Mmm, M&M's
Here is another version of the classic M&M math lesson. In this one, upper graders utilize the ClarisWorks Spreadsheet program in order to document the data they come up with from their bags of M&M's. After making their initial...
Curated OER
Global Warming - The Heat is On: Global Climate Change Revisited
After listening to your lecture on climate change, young scientists access NOAA's database listing Mauna Loa's carbon dioxide data. They graph the monthly means and then compare their graphs to NOAA's. This is a concise plan that could...
Curated OER
Using Negative Numbers
Fourth graders explore negative numbers with this resource. They discuss positive and negative numbers by counting who is present and absent, placing numbers on a number line, and graphing temperatures. Using a variety of activities,...
Curated OER
Fractions and Measurement
Using a Smart Board, or a plain ol' white board or chalkboard, the teacher pulls up a grid and demonstrates how squares and rectangles can be divided up into equal parts. The class will get their own graph paper to draw shapes and divide...
Curated OER
Sharks ~ Taking a Bite Out of the Myth
The first thing to know about this lesson is that the commercial fisheries data for the activity no longer seems to be available. That being said, there are fascinating links to other websites, some about the comparative odds of being...
National Council of Teachers of Mathematics
National Debt and Wars
Take a functional approach to the national debt. Learners collect information about the national debt by decade and plot the data. They determine whether an exponential curve is a good fit for the data by comparing the percent changes...
Curated OER
Dragonwings: Explore Chapters 1-5
If you are beginning Laurence Yep's Dragonwings, this will provide activities for the first five chapters. The objectives include making connections to oneself and the world, organizing information and events, vocabulary acquisition,...
Curated OER
Sandia Aerial Tram
Your learners analyze a table of real-life data in order to write an equation that best models the information. Exponential, quadratic, and linear rates of changes are all possibilities in this task.
Curated OER
Feeding in the Flow
The National Oceanic and Atmospheric Administration (NOAA) has developed a tremendous library of ocean-themed lessons that can be used in a variety of science settings. "Feeding in the Flow" is one of those activities; Its focus is on...
Curated OER
1, 2, 3, Read!
Explain to your readers a variety of decoding strategies to improve their reading fluency. They observe the teacher modeling blending, then in pairs take turns reading the book Clifford the Big Red Dog. Learners then time each other...
Other popular searches
- Coordinate Graphing Pictures
- Graphing Ordered Pairs
- Graphing Skills Lesson Plans
- Coordinate Graphing
- Graphing Linear Equations
- Holiday Coordinate Graphing
- Graphing Linear Inequalities
- Graphing Calculator
- Graphing Inequalities
- Halloween Math Graphing
- Graphing Mean, Median, Mode
- Graphing Data


