Chicago Botanic Garden
Historical Climate Cycles
What better way to make predictions about future weather and climate patterns than with actual climate data from the past? Young climatologists analyze data from 400,000 to 10,000 years ago to determine if climate has changed over...
Columbus City Schools
To Measure its Mass or Volume?
Atoms, elements, and molecules, oh my! Teaching the fundamentals of chemistry to curious sixth graders has never been easier to accomplish. Here is a resource that pulls together everything needed to get them off to a good start,...
Columbus City Schools
Speed Racers
Who wants to go fast? The answer? Your sixth-grade science superstars! The complete resource offers the ultimate, all-inclusive playbook for mastering the important concepts of speed versus time; distance versus time; and how...
Howard Hughes Medical Institute
Seed Dispersal in Tropical Forests
How do seeds get around? It's not like plants can control seed dispersal—or can they? Dig deeper into the amazing mechanisms of seed dispersal observed in tropical plants through interactives, a video, and plenty of hands-on data...
Curated OER
Solar Heating in the Himalayas
A fascinating lesson plan on how solar power is utilized by people who live in the Himalayas is here for you. In it, learners perform a case study which will help them understand that solar energy is a renewable resource, that geography...
Chymist
The Solubility of a Salt in Water at Various Temperatures
An educational activity allows young chemists to test the solubility of different types of salt at various temperatures. Groups create a graph using data from unsaturated, saturated, and supersaturated solutions.
NASA
The Big Climate Change Experiment Lesson 3: Climate Change Lines of Evidence
Consider the preponderance of evidence when making a verdict. The third of five lessons in Unit 1: The Big Climate Change Experiment focuses on the evidence for climate change. Learners study graphs, diagrams, and pictures regarding...
Towson University
Looking Backwards, Looking Forward
How do scientists know what Earth's climate was like millions of years ago? Young environmental scholars discover how researchers used proxy data to determine the conditions present before written record. Grouped pupils gain experience...
BW Walch
Creating and Graphing Exponential Equations
Frequently found in biology and economic application problems, exponential equations show up as stars in this introductory presentation. Taking no background or knowledge of exponentials for granted, the slides walk learners...
Curated OER
Ornithology and Real World Science
Double click that mouse because you just found an amazing lesson! This cross-curricular Ornithology lesson incorporates literature, writing, reading informational text, data collection, scientific inquiry, Internet research, art, and...
National Wildlife Federation
Wherefore Art Thou, Albedo?
In the sixth lesson in a series of 21, scholars use NASA data to graph and interpret albedo seasonally and over the course of multiple years. This allows learners to compare albedo trends to changes in sea ice with connections to the...
Mascil Project
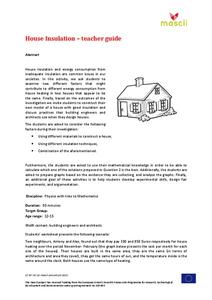
House Insulation
Make sure your house is warm in the winter. Pupils analyze graphs of heating costs for two similar houses and make hypotheses for why the costs differ. They then build models of houses with appropriate insulation to reduce heating costs.
Beyond Benign
The Big Melt: Arctic Ice Caps
Are the Arctic ice caps really melting out of existence? Junior climatologists examine the statistics of ice decline through four math-based lessons. Each activity incorporates data, climate information, and environmental impact into an...
Beyond Benign
Orb-It
How do the products you use rate on a greeness scale? Scholars use a tool to analyze shampoos and cars for their sustainability. They consider factors that affect the environment, the economy, and equity. This is the ninth lesson in...
Towson University
It's a Gassy World!
How much does your class know about the relationship between climate change and carbon dioxide? Science scholars explore the nature of greenhouse gases and rising ocean temperature through demonstrations, research, and experiments. The...
Curated OER
Re-Presenting Race in the Digital Age
Teen-aged scientists analyze a graphic organizer of how trash is removed from New York City and then answer standard questions about a graph and a diagram. Resources are mentioned, but there are no links to these resources, so you will...
Howard Hughes Medical Institute
Population Genetics, Selection, and Evolution
The Hardy-Weinberg principle states that alleles and genotypes remain constant in the absence of evolutionary influences. Scholars complete a simple hands-on activity applying the Hardy-Weinberg principle to sample data. They observe how...
PBS
Analyzing Light Curves of Transiting Exoplanets
Scientists detected exoplanets by measuring how the brightness of stars changed over time. Young astronomers interpret and analyze the same data that led to exoplanet discoveries. They learn to apply light curve graphs and connect the...
Virginia Department of Education
Solar System Model
How many planets can you name? Did you get all 13 in our solar system, including the dwarf planets, or were you surprised when you read there are 13 planets? The lesson helps scholars understand the scale of the universe including the...
Science 4 Inquiry
The Ups and Downs of Populations
Life has its ups and downs ... especially if you're an animal! Biology scholars engage in a population study through an inquiry-based lesson. Pupils work together to explore the factors that affect deer populations, then examine the...
Howard Hughes Medical Institute
Lactase Persistence: Evidence for Selection
What's the link between lactase persistence and dairy farming? Biology scholars analyze data to find evidence of the connection, then relate this to human adaptation. Working individually and in small groups, learners view short video...
Science 4 Inquiry
The Ups and Downs of Populations
As the reality of population decline across many species becomes real, pupils learn about the variables related to changes in populations. They complete a simulation of population changes and graph the results, then discuss limiting...
Michigan State University
Bug Lyphe!
Introduce ecology classes to biodiversity and interdependence in ecosystems with a PowerPoint presentation. Then, they get up-close and personal with the invertebrate world by collecting insects, classifying them, and graphing their...
Serendip
Changing Biological Communities – Disturbance and Succession
After cutting down a forest to make a farm, how long would it take the environment to turn an abandoned farm back into a forest? Scholars study this exact scenario while they interpret many charts and graphs of the changing ecosystems as...


