Geometry Accelerated
Coordinate Geometry Additional Practice
Your learners get extra practice using coordinates in calculating mid points, finding end points, deciding if points are collinear, calculations using slope concepts, writing linear equations, using triangles and quadrilaterals, and...
EngageNY
Using Sample Data to Compare the Means of Two or More Populations II
The 23rd segment in a series of 25 presents random samples from two populations to determine whether there is a difference. Groups determine whether they believe there is a difference between the two populations and later use an...
Virginia Department of Education
Practical Problems Involving Decimals
After discussing decimals and "going shopping" in the classroom, young mathematicians are given four practical word problems that require them to estimate their answers, given specific information. The highlight of the lesson is...
Green Planet Solar Energy.com
Order of Operations 2 - More Practice!
Your learners will get plenty of practice calculating expressions remembering to use order of operations in this worksheet.
NOAA
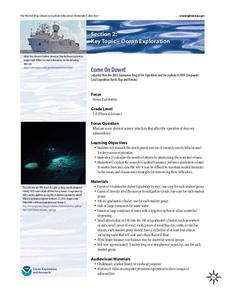
Come on Down!
What do we do when a dive is too dangerous for humans to accomplish? Send in the robots! Middle school scientists get acquainted with several different models of submersible robots in the second lesson of six from NOAA. Lab groups then...
Virginia Department of Education
Exploring 3-D Geometry
Take young mathematicians on an exploration of the world of 3-D geometry with this seven-lesson unit. After first defining the terms perimeter, area, and volume and how they apply to the real world, students continue on...
Mrs. Burke's Math Page
Let Them Eat Pi
Looking for a fun and creative way to celebrate Pi Day? Then this is the resource for you. From a scavenger hunt and trivia contest to PowerPoint presentations and skills practice worksheets, this collection of materials is a...
EngageNY
More on Modeling Relationships with a Line
How do you create a residual plot? Work as a class and in small groups through the activity in order to learn how to build a residual plot. The activity builds upon previous learning on calculating residuals and serves as a...
Shodor Education Foundation
Stem and Leaf Plotter
The key is in the leaves. Pupils enter data to create a stem-and-leaf plot. The resource then displays the plot and calculates the mean, median, and mode of the data. Using the plot and the calculated measures of spread, learners analyze...
Making Math More Fun
Making Math More Fun
Address fundamental math skills with a series of fun math board games. With 25 games that focus on addition, subtraction, multiplication, division, place value, and percentages, kids will quickly find that math practice is their favorite...
Illustrative Mathematics
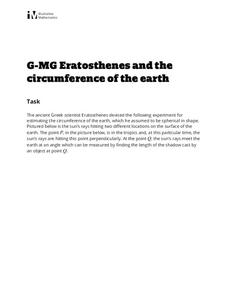
Eratosthenes and the Circumference of the Earth
The class gets to practice being a mathematician in ancient Greece, performing geometric application problems in the way of Eratosthenes. After following the steps of the great mathematicians, they then compare the (surprisingly...
Teach Engineering
Flame Test: Red, Green, Blue, Violet?
Let the true colors shine through. Pupils conduct a flame test to identify an unknown element. Class members calculate and prepare specific molarity solutions of three chemicals. Using their observations of the colors emitted, they...
EngageNY
Estimating Probabilities by Collecting Data
Take a spin to determine experimental probability. Small groups spin a spinner and keep track of the sums of the spins and calculate the resulting probabilities. Pupils use simulated frequencies to practice finding other probabilities to...
Houghton Mifflin Harcourt
Simple and Compound Interest
Your learners will get lots of practice calculating simple and compound interest by the end of this lesson. Simple explanations and examples lead learners through the concepts and steps of calculating simple and compound interest...
EngageNY
Interpreting Correlation
Is 0.56 stronger than -0.78? Interpret the correlation coefficient as the strength and direction of a linear relationship between two variables. An algebra instructional activity introduces the correlation coefficient by estimating...
EngageNY
An Area Formula for Triangles
Use a triangle area formula that works when the height is unknown. The eighth installment in a 16-part series on trigonometry revisits the trigonometric triangle area formula that previously was shown to work with the acute triangles....
EngageNY
Getting the Job Done—Speed, Work, and Measurement Units II
How fast is your class? Learners determine the amount of time it takes individuals to walk a given distance and calculate their speeds. Pupils solve distance, rate, and time problems using the formula and pay attention to the...
Illustrative Mathematics
The Lighthouse Problem
Long considered the symbol of safe harbor and steadfast waiting, the lighthouse gets a mathematical treatment. The straightforward question of distance to the horizon is carefully presented, followed by a look into the...
Howard County Schools
Drawing Inverses
An Algebra II lesson draws the connection between the exponential function and its inverse. By graphing an exponential function and using tables and a calculator, students graph the logarithmic function. The plan comes with a...
Mathematics Vision Project
Module 8: Modeling Data
Statistics come front and center in this unit all about analyzing discrete data. Real-world situations yield data sets that the class then uses to tease out connections and conclusions. Beginning with the basic histogram and...
EngageNY
Dilations on the Coordinate Plane
Dilations from the origin have a multiplicative effect on the coordinates of a point. Pupils use the method of finding the image of a point on a ray after a dilation to find a short cut. Classmates determine the short cut of being...
Statistics Education Web
Who Sends the Most Text Messages?
The way you use statistics can tell different stories about the same set of data. Here, learners use sets of data to determine which person sends the most text messages. They use random sampling to collect their data and calculate a...
EngageNY
The Scaling Principle for Area
As they investigate scaling figures and calculate the resulting areas, groups determine the area of similar figures. They continue to investigate the results when the vertical and horizontal scales are not equal.
Curated OER
Snail Invasion
Exponential growth is modeled by learners as they analyze and interpret the data presented in this real-life scenario centered on the destructive invasion of the Giant African Land Snail. Learners get a touch of history and practice...


