American Statistical Association
Step into Statastics
Class members study the size of classmates' feet and perform a statistical analysis of their data. They solve for central tendencies, quartiles, and spread for the entire group as well as subgroups. They then write a conclusion based on...
EngageNY
The Mean Absolute Deviation (MAD)
Is there a way to measure variability? The ninth resource in a series of 22 introduces mean absolute deviation, a measure of variability. Pupils learn how to determine the measure based upon its name, then they use the mean absolute...
Curated OER
Drive the Data Derby
Three days of race car design and driving through the classroom while guessing probability could be a third graders dream. Learn to record car speed, distances traveled, and statistics by using calculation ranges using the mean, median,...
Differentiation Central
Perimeter and Area
Leave no student behind with this differentiated geometry unit on perimeter and area. Over the course of five lessons, young mathematicians explore these foundational concepts through a series of self-selected hands-on activities and...
EngageNY
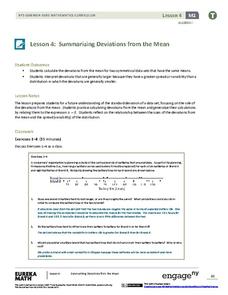
Summarizing Deviations from the Mean
Through a series of problems, learners determine the variability of a data set by looking at the deviations from the mean. Estimating means of larger data sets presented in histograms and providing a way to calculate an estimate round...
Alabama Learning Exchange
Sky High
How are skyscrapers built? What does it take to make a structurally sound building? How can one work within a budget to complete a building project? These guiding questions will be investigated and answered within a hands-on lesson....
American Statistical Association
How Fast Are You?
Quick! Snap up the instructional activity. Scholars first use an online app to collect data on reaction times by clicking a button when the color of a box changes. They then plot and analyze the data by considering measures of center,...
Mathematics Vision Project
Module 6: Congruence, Construction, and Proof
Trace the links between a variety of math concepts in this far-reaching unit. Ideas that seem very different on the outset (like the distance formula and rigid transformations) come together in very natural and logical ways. This unit...
Shodor Education Foundation
Sets and the Venn Diagram (Beginner)
Venn diagrams are helpful in understanding the idea of a set and using attributes to sort items. This basic plan is an introduction with an added bonus of an applet that can be used to demonstrate the activity. If a classroom of...
PBS
Garden Grade 6 Area and Perimeter
Engage young mathematicians in applying their knowledge of area and perimeter with a fun geometry lesson. Through a series of problem solving exercises, children use their math knowledge to design different-sized garden plots that meet...
American Statistical Association
What is the Probability of “Pigging Out”
Learners apply their understanding of luck to a probability experiment. They play a game of Pass the Pigs to determine the probability of a specific outcome. Using analysis for their data, pupils declare the measures of center, dot...
Shodor Education Foundation
Pythagorean Explorer
Make sure the measurement is right. The interactive provides right triangles with a missing side measurement. Pupils use the given sides and the Pythagorean Theorem to calculate the length of the missing side. After entering the length,...
Curated OER
Representing Data 1: Using Frequency Graphs
Here is a activity that focuses on the use of frequency graphs to identify a range of measures and makes sense of data in a real-world context as well as constructing frequency graphs given information about the mean, median, and range...
Shodor Education Foundation
Squaring the Triangle
Teach budding mathematicians how to square a triangle with an interactive that shows a graphical proof of the Pythagorean Theorem. Pupils alter the lengths of the legs using sliders. Using the inputted lengths, the applet displays the...
Mathematics Assessment Project
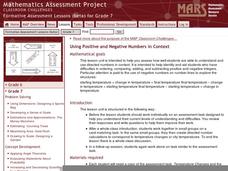
Using Positive and Negative Numbers in Context
Measure the temperature of your math class with a temperature-based lesson on adding and subtracting rational numbers. The thermometer serves as a vertical number line for learners as they work together to solve a temperature change...
Shodor Education Foundation
Plop It!
Build upon and stack up data to get the complete picture. Using the applet, pupils build bar graphs. As the bar graph builds, the interactive graphically displays the mean, median, and mode. Learners finish by exploring the changes in...
Curated OER
Basketball Bounces, Assessment Variation 2
This un-scaffold summative assessment tasks learners to use the height of a bouncing basketball, given the data in graph and table form, to choose the model that is represented. Learners then use the model to answer questions about the...
Curated OER
Basketball Bounces, Assessment Variation 1
This highly scaffolded, summative assessment tasks learners to choose the model that represents the height of a bouncing basketball given the data in graph and table form. Learners then use the model to answer questions about the...
NASA
Food For Thought
Science can be quite tasty. A delectable unit from NASA shows learners why it's important to consider food, nutrition, and health in space. Four lessons explore the idea in great depth, including testing cookie recipes. Along the way,...
Baylor College
Using Heat from the Sun
Let's heat things up! This simple experiment demonstrates for learners the important role the sun plays in providing the earth with energy. Place one cup of water in direct sunlight and one in shade, then take measurements in order to...
National Council of Teachers of Mathematics
Eruptions: Old Faithful Geyser
How long do we have to wait? Given several days of times between eruptions of Old Faithful, learners create a graphical representation for two days. Groups combine their data to determine an appropriate wait time between eruptions.
Virginia Department of Education
Attributes of a Rectangular Prism
A change is coming. Pupils use unit cubes to investigate how changes in the length, width, and/or height affects volume and surface area. They extend the results to write and test predictions on the effect of changing multiple sides on...
Virginia Department of Education
Exploring 3-D Geometry
Take young mathematicians on an exploration of the world of 3-D geometry with this seven-lesson unit. After first defining the terms perimeter, area, and volume and how they apply to the real world, students continue on to learn the...
Curated OER
Access Ramp
Just about every public building that your students are familiar with has an access ramp which complies with ADA requirements. As it turns out, designing such a ramp is an excellent activity to incorporate slope, the Pythagorean Theorem,...


