Virginia Department of Education
Linear Curve of Best Fit
Is foot length to forearm length a linear association? The class collects data of fellow scholars' foot length and the length of their forearms. They plot the data and find a line of best fit. Using that line, they make predictions of...
EngageNY
Graphs of Piecewise Linear Functions
Everybody loves video day! Grab your class's attention with this well-designed and engaging resource about graphing. The video introduces a scenario that will be graphed with a piecewise function, then makes a connection to domain...
West Contra Costa Unified School District
The Power of Ten: Building a Magnitude Model
Add visual representation to teaching place value with a magnitude model. Using adding machine tape, pupils build a linear place value strip from 1 to 100.
Project Maths
Inequalities
Which number is bigger? Using a variety of activity sheets, this unit starts with the basics of inequalities and progresses through solving compound linear inequalities. Problems cover the range of inequalities including inequality word...
Radford University
Finding Slope
The class takes a trip about the school and find four places to measure the rise and run of objects that represent slope in the building. Pairs work together to calculate the slope of each object and determine whether any ramp they find...
EngageNY
The Slope of a Non-Vertical Line
This lesson introduces the idea of slope and defines it as a numerical measurement of the steepness of a line. Pupils then use the definition to compare lines, find positive and negative slopes, and notice their definition holds for...
Georgetown University
Cup-Activity: Writing Equations From Data
Determine how cup stacking relates to linear equations. Pupils stack cups and record the heights. Using the data collected, learners develop a linear equation that models the height. The scholars then interpret the slope and the...
American Statistical Association
What Fits?
The bounce of a golf ball changes the result in golf, mini golf—and a great math activity. Scholars graph the height of golf ball bounces before finding a line of best fit. They analyze their own data and the results of others to better...
Curated OER
Accurately Weighing Pennies I
Drawing from a scenario of the history of the penny, learners write and solve a system of linear equations from a context.
EngageNY
More on Modeling Relationships with a Line
How do you create a residual plot? Work as a class and in small groups through the activity in order to learn how to build a residual plot. The activity builds upon previous learning on calculating residuals and serves as a precursor to...
EngageNY
Interpreting Correlation
Is 0.56 stronger than -0.78? Interpret the correlation coefficient as the strength and direction of a linear relationship between two variables. An algebra lesson introduces the correlation coefficient by estimating and then calculating it.
Radford University
How do I Create a Scaled Model of a Full-Sized Basketball Court?
Take mathematics to the hoop! Pairs first measure the linear distances on a basketball court. Using those measurements, they determine the scale lengths to create a scaled model. To finish the activity, learners create models of the...
Radford University
Staircases and Ramps
Ramp up the study of slope. The class participates in a discussion about the physical aspects of stairs and ramps they encounter. Small groups work together and measure a staircase and corresponding ramp to calculate the slope of each....
Differentiation Central
Perimeter and Area
Leave no student behind with this differentiated geometry unit on perimeter and area. Over the course of five lessons, young mathematicians explore these foundational concepts through a series of self-selected hands-on activities and...
Teach Engineering
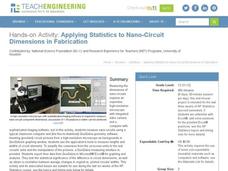
Applying Statistics to Nano-Circuit Dimensions in Fabrication
Do flexible circuits change dimensions during fabrication? Groups use GeoGebra software to measure the length of pictures of flexible nano-circuits. To determine if the circuits change dimensions, future engineers use Microsoft Excel to...
Curated OER
Hand Span and Height
Is there a relationship between hand span width and height? Statisticians survey each other by taking measurements of both. A table that can hold data for 24 individuals is printed onto the worksheet, along with questions for analysis....
Virginia Department of Education
Lines and Angles
Explore angle relationships associated with transversals. Pupils construct parallel lines with a transversal and find the measures of the angles formed. They figure out how the different angles are related before constructing...
Illustrative Mathematics
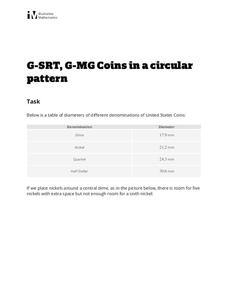
Coins in a Circular Pattern
What starts as a basic question of division and remainders quickly turns abstract in this question of related ratios and radii. The class works to surround a central coin with coins of the same and different values, then develops a...
EngageNY
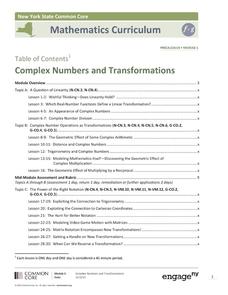
Complex Numbers and Transformations
Your learners combine their knowledge of real and imaginary numbers and matrices in an activity containing thirty lessons, two assessments (mid-module and end module), and their corresponding rubrics. Centered on complex numbers and...
EngageNY
Conversion Between Celsius and Fahrenheit
Develop a formula based upon numerical computations. The 31st part of a 33-part unit has the class determine the formula to convert a temperature in Celsius to a temperature in Fahrenheit. They do this by making comparisons between the...
Mathematics Vision Project
Module 6: Congruence, Construction, and Proof
Trace the links between a variety of math concepts in this far-reaching unit. Ideas that seem very different on the outset (like the distance formula and rigid transformations) come together in very natural and logical ways. This unit...
Curated OER
Logistic Growth Model, Explicit Version
Via the concrete setting of estimating the population of the US, your algebra learners are introduced to a logistic growth model. Comparing and contrasting logistic, exponential, linear and quadratic models, to see which fits the data...
EngageNY
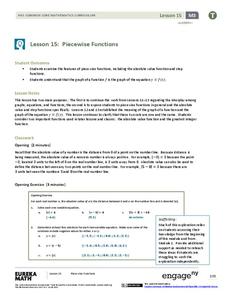
Piecewise Functions
Show your class members that if they can graph a linear function, they can graph an absolute value function. Groups create an absolute value graph using a table, then entertain the idea of an absolute value function defined as two pieces...
Curated OER
Accurately Weighing Pennies II
Drawing from a scenario of the history of the penny, learners write and solve a system of linear equations from a context.


