Mathematics Assessment Project
Interpreting Distance–Time Graphs
Pre-algebra protégés critique a graph depicting Tom's trip to the bus stop. They work together to match descriptive cards to distance-time graph cards and data table cards, all of which are provided for you so you can make copies for...
Curated OER
Identifying Linear Functions from Graphs
Keep your mathematicians engaged using this group linear functions activity. Each of ten groups receives two graphs with both an image and equation, as well as a "who has" phrase to call out the next graph. Scholars stay on their toes as...
Illustrative Mathematics
Weather Graph Data
Teaching young mathematicians about collecting and analyzing data allows for a variety of fun and engaging activities. Here, children observe the weather every day for a month, recording their observations in the form of a bar graph....
EngageNY
The Graph of a Linear Equation in Two Variables
Add more points on the graph ... and it still remains a line! The 13th installment in a series of 33 leads the class to the understanding that the graph of linear equation is a line. Pupils find several solutions to a two-variable linear...
EngageNY
Graphing the Tangent Function
Help learners discover the unique characteristics of the tangent function. Working in teams, pupils create tables of values for different intervals of the tangent function. Through teamwork, they discover the periodicity, frequency, and...
Ohio Literacy Resource Center
Solving Systems of Linear Equations Graphing
Do you need to graph lines to see the point? A thorough lesson plan provides comprehensive instruction focused on solving systems of equations by graphing. Resources include guided practice worksheet, skill practice worksheet, and an...
Curated OER
Drive the Data Derby
Three days of race car design and driving through the classroom while guessing probability could be a third graders dream. Learn to record car speed, distances traveled, and statistics by using calculation ranges using the mean, median,...
EngageNY
Interpreting, Integrating, and Sharing Information: Using Charts and Graphs about DDT
Is American growing fatter? Scholars begin with a mini lesson plan on reading charts and graphs using information about Human Body Fat in United States. They then transfer what they learned to charts and graphs using harmful and...
EngageNY
Analyzing Graphs—Water Usage During a Typical Day at School
Connect your pupils to the problem by presenting a situation with which they can identify. Individuals analyze a graph of water use at a school by reasoning and making conclusions about the day. The lesson emphasizes units and labels of...
EngageNY
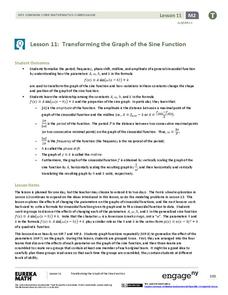
Transforming the Graph of the Sine Function
Build a solid understanding of trigonometric transformations through exploration. Learners work in teams to analyze the effects of different algebraic components on the graph of a sine function.
West Contra Costa Unified School District
Connecting Graphing and Solving Absolute Value Equations and Functions
Can you solve an equation graphically? Absolutely! This Algebra II lesson makes the connection between solving an absolute value equation and graphing two functions. Graphing absolute value functions is presented through the process of...
Curated OER
Usage and Interpretation of Graphs
Cooperative groups are formed for this graphing activity. Each group must construct a graph that represents how many eyelets (the holes for laces in shoes), are present in their group. A whole-class bar graph is eventually constructed...
Macmillan Education
Sine and Cosine Graphs
Learners compare and contrast sine and cosine graphs in order to describe their characteristics in a collaborative activity. As they explain their reasoning, learners strengthen their writing and vocabulary skills associated with sine...
Annenberg Foundation
Skeeters Are Overrunning the World
Skeeters are used to model linear and exponential population growth in a wonderfully organized lesson plan including teachers' and students' notes, an assignment, graphs, tables, and equations. Filled with constant deep-reaching...
Anti-Defamation League
Pink Collar Jobs: Gender Segregation and Pay Inequality in the Workplace
Cartoons showing women in the workplace spark a discussion about being a business executive and claiming the corporate ladder. Small groups analyze data and create graphs that display essential information from the handouts. The class...
Pace University
Grade 7 Earth Day Statistics with Circle and Bar Graphs
Take a tiered approach to studying waste. The lesson plan uses Earth Day to present differentiated instruction around using circle and bar graphs. Each group gets a cube based on their tiers and works collaboratively as well as...
Centers for Ocean Sciences
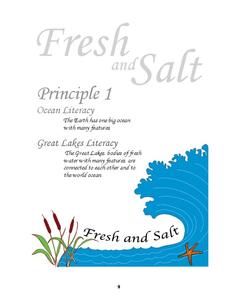
Ocean and Great Lakes Literacy: Principle 1
Is your current lesson plan for salt and freshwater literacy leaving you high and dry? If so, dive into part one of a seven-part series that explores the physical features of Earth's salt and freshwater sources. Junior hydrologists...
Curated OER
Great Lakes Homepage for Kids
Here are some outstanding lessons on the geology and history of the Great Lakes. These lessons are divided into Grade 4 -6, and Grade 7 - 8 activities. The activities all use the background information, maps, graphs, data, and Great...
Fredonia State University of New York
Watch Your Step…You May Collide!
Can two lines intersect at more than one point? Using yarn, create two lines on the floor of the classroom to find out. Cooperative groups work through the process of solving systems of equations using task cards and three different...
NASA
Ascent: 50 Seconds to MECO
All systems go! With a video and a Google Earth tour as background, pairs investigate two graphs. The graphs display acceleration vs. time and velocity vs. time of a space shuttle launch. Using graphing calculators, the pairs take a...
EngageNY
Introduction to Simultaneous Equations
Create an understanding of solving problems that require more than one equation. The lesson introduces the concept of systems of linear equations by using a familiar situation of constant rate problems. Pupils compare the graphs of...
EngageNY
Horizontal and Vertical Asymptotes of Graphs of Rational Functions
Get close to your favorite line. Scholars use end behavior to help find horizontal asymptotes. With the understanding of domains of rational functions, learners find vertical asymptotes and then use graphing calculators to verify the...
NASA
Cloudy vs. Clear - Graphs
Explore the link between solar energy and cloud cover using real data from NASA from China! Future climatologists analyze and interpret graphs of solar energy on clear and cloudy days using a literacy cube. Investigators draw conclusions...
Missouri Department of Elementary
Ingredients of a Relationship Recipe
An eye-catching hook makes a smart analogy between ingredients for a food recipe and ingredients for quality relationships. Scholars discuss and list qualities they feel contribute to positive interactions. Pupils create a recipe card...
Other popular searches
- Graphing Skills Lesson Plans
- Basic Graphing Skills
- Organizing and Graphing Data
- Introducing Graphing Skills
- Graphing Skills Using M&ms
- Graphing Skills in Science
- Graphing Skills for Prek
- Graphing Skills With Fruits
- Graphing Skills in Chemistry
- Graphing Skills for Perk
- Graphing Skills Worksheet
- Reading Graphing Skills


