EngageNY
Revisiting the Graphs of the Trigonometric Functions
Use the graphs of the trigonometric functions to set the stage to inverse functions. The instructional activity reviews the graphs of the basic trigonometric functions and their transformations. Pupils use their knowledge of graphing...
Mt. San Antonio Collage
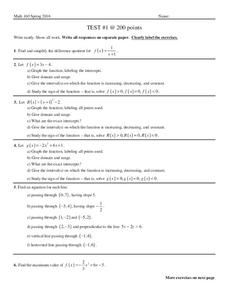
Test 1: Graphing Functions
Graph the night away with all the different types of functions provided in the worksheet. Linear, quadratic, and rational all ask for graphs, domain and range and other key factors about the functions.
West Contra Costa Unified School District
Connecting Graphing and Solving Absolute Value Equations and Functions
Can you solve an equation graphically? Absolutely! This Algebra II lesson makes the connection between solving an absolute value equation and graphing two functions. Graphing absolute value functions is presented through the process of...
EngageNY
Graphs Can Solve Equations Too
There are many equations Algebra I students are not ready to solve. Graphing to solve gives them a strategy to use when they are unsure of an algebraic approach to solve the problem. The instructional activity exposes learners to a...
EngageNY
The Height and Co-Height Functions of a Ferris Wheel
Show learners the power of mathematics as they model real-life designs. Pupils graph a periodic function by comparing the degree of rotation to the height of a ferris wheel.
Mt. San Antonio Collage
Graphing Trigonometric Functions
Double win with a comprehensive worksheet and an excellent worked out answer key. The worksheet itself is twelve pages and begins with the simple sine and cosine graphs, then, develops into the reciprocal trig functions.
EngageNY
Horizontal and Vertical Asymptotes of Graphs of Rational Functions
Get close to your favorite line. Scholars use end behavior to help find horizontal asymptotes. With the understanding of domains of rational functions, learners find vertical asymptotes and then use graphing calculators to verify the...
EngageNY
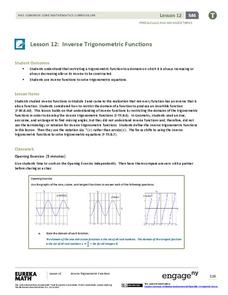
Inverse Trigonometric Functions
Build on the understanding of finding angles using trigonometric ratios. Pupils develop the definitions of inverse trigonometric functions by restricting their domains in the 13th lesson of a 16-part series. They use inverse functional...
Mt. San Antonio Collage
Test 1: Functions and Their Graphs
Save the time creating an assessment because these function problems should do the trick. With 10 multi-part questions, they each focus on a different topic including radical, polynomial, linear and piecewise functions. The majority of...
Mt. San Antonio Collage
Quiz 1: Types of Functions
Sometimes the best things are already done for you! Here is a six-problem quiz that has a variety of problems ranging from solving quadratic equations to interpreting a function. The piece-de-resistance is the worked out answer key in...
Mt. San Antonio Collage
Quiz 2: Types of Functions
Here is a resource that provides the structure of an assessment with the convenience of a full answer key. The focus is on rational, exponential, and logarithm functions with a few questions on solving polynomials.
EngageNY
Transformations of the Quadratic Parent Function
Efficiently graph a quadratic function using transformations! Pupils graph quadratic equations by completing the square to determine the transformations. They locate the vertex and determine more points from a stretch or shrink and...
EngageNY
Modeling a Context from a Graph
Collaborative pairs develop functions that model a graph from a context using the modeling cycle. They then analyze their function models in order to answer questions about the scenario.
EngageNY
Properties of Trigonometric Functions
Given a value of one trigonometric function, it is easy to determine others. Learners use the periodicity of trigonometric functions to develop properties. After studying the graphs of sine, cosine, and tangent, the lesson connects...
Mt. San Antonio Collage
Quiz 1: Functions, Domain and Range
Take the work out of worksheets and use these problems and worked-out answer key as a resource. The problems reinforce skills in domain and range, identifying graphs, and even and odd functions.
Ohio Literacy Resource Center
Solving Systems of Linear Equations Graphing
Do you need to graph lines to see the point? A thorough lesson plan provides comprehensive instruction focused on solving systems of equations by graphing. Resources include guided practice worksheet, skill practice worksheet,...
EngageNY
Comparing Linear and Exponential Models Again
Making connections between a function, table, graph, and context is an essential skill in mathematics. Focused on comparing linear and exponential relationships in all these aspects, this resource equips pupils to recognize and interpret...
EngageNY
Solution Sets to Inequalities with Two Variables
What better way to learn graphing inequalities than through discovering your own method! Class members use a discovery approach to finding solutions to inequalities by following steps that lead them through the process and...
EngageNY
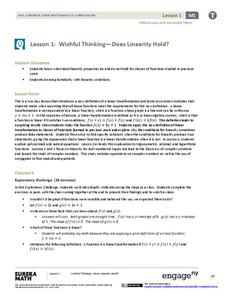
Wishful Thinking—Does Linearity Hold? (Part 1)
Not all linear functions are linear transformations — show your class the difference. The first instructional activity in a unit on linear transformations and complex numbers that spans 32 segments introduces the concept of linear...
EngageNY
Modeling with Quadratic Functions (part 2)
How many points are needed to define a unique parabola? Individuals work with data to answer this question. Ultimately, they determine the quadratic model when given three points. The concept is applied to data from a dropped...
Teach Engineering
Can You Resist This?
Some things are hard to resist. Small collaborative groups build circuits and calculate the voltage using Ohm's Law. Budding engineers explore the connection between the voltage across different resistors and linear...
Illustrative Mathematics
Bike Race
A graph not only tells us who won the bike race, but also what happened during the race. Use this resource to help learners understand graphs. The commentary suggests waiting until the end of the year to introduce this topic, but why...
EngageNY
Modeling a Context from a Verbal Description (part 2)
I got a different answer, are they both correct? While working through modeling problems interpreting graphs, the question of precision is brought into the discussion. Problems are presented in which a precise answer is needed and...
EngageNY
Modeling a Context from a Verbal Description (part 1)
When complicated algebraic expressions are involved, it is sometimes easier to use a table or graph to model a context. The exercises in this lesson are designed for business applications and require complex algebraic...


