EngageNY
End Behavior of Rational Functions
Connect end behavior to previous learning. Pupils connect finding the end behavior of rational functions to finding end behavior of polynomial functions. The 13th segment in a 23-part unit starts with finding the end behavior or power...
Mathalicious
Domino Effect
Carryout the instructional activity to determine the cost of pizza toppings from a Domino's Pizza® website while creating a linear model. Learners look through real data—and even create their own pizza—to determine the cost of each...
EngageNY
Dilations on the Coordinate Plane
Dilations from the origin have a multiplicative effect on the coordinates of a point. Pupils use the method of finding the image of a point on a ray after a dilation to find a short cut. Classmates determine the short cut of being able...
Radford University
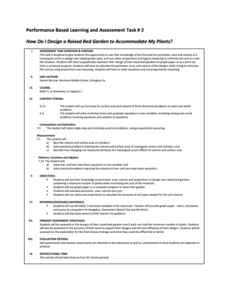
How Do I Design a Raised Bed Garden to Accommodate My Plants?
Give plants the best place to grow. Given constraints on plant spacing, pupils design a raised bed garden using graph paper, then calculate the perimeter, surface area, and volume. They use the provided costs of lumber and soil to...
Radford University
Tiling
What more could we want from floor tiles? Using pattern blocks and graph paper, pupils determine ways to completely tile a floor of given dimensions. They consider the aesthetic quality of the tiles by creating a tessellation and...
Radford University
Staircases and Ramps
Ramp up the study of slope. The class participates in a discussion about the physical aspects of stairs and ramps they encounter. Small groups work together and measure a staircase and corresponding ramp to calculate the slope of each....
EngageNY
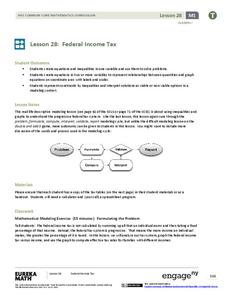
Federal Income Tax
Introduce your class to the federal tax system through an algebraic lens. This resource asks pupils to examine the variable structure of the tax system based on income. Young accountants use equations, expressions, and inequalities to...
Teach Engineering
Can You Resist This?
Some things are hard to resist. Small collaborative groups build circuits and calculate the voltage using Ohm's Law. Budding engineers explore the connection between the voltage across different resistors and linear functions with...
EngageNY
Modeling a Context from Data (part 1)
While creating models from data, pupils make decisions about precision. Exercises are provided that require linear, quadratic, or exponential models based upon the desired precision.
Shodor Education Foundation
Two Variable Function Pump
Use a function to operate on two variables. Pupils look at operating with complex numbers as a function of two variables. The interactive squares the input and adds a constant to it. Learners visualize the resulting output and its...
American Statistical Association
Armspans
Young mathematicians collect data on the arm spans of classmates. Then they sort the data by measures of center, spread, and standard deviation. Finally, they compare groups, such as boys and girls, to interpret any differences.
Mathed Up!
Pie Charts
Representing data is as easy as pie. Class members construct pie charts given a frequency table. Individuals then determine the size of the angles needed for each sector and interpret the size of sectors within the context of frequency....
Curated OER
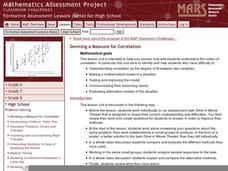
Devising a Measure for Correlation
How well does your class understand the concept of correlation? Use an activity to explore different methods of calculating correlation. Working alone and then in groups, your class will make decisions on what math to apply to the...
WindWise Education
What Factors Influence Offshore Wind?
What is that out in the water on the horizon? Teams work together to study the coastline using maps to determine the best and worst locations to place an offshore wind farm. The teams then build a scale model wind farm to see what it...
EngageNY
Modeling Relationships with a Line
What linear equation will fit this data, and how close is it? Through discussion and partner work, young mathematicians learn the procedure to determine a regression line in order to make predictions from the data.
EngageNY
When Can We Reverse a Transformation? 1
Wait, let's start over — teach your class how to return to the beginning. The first lesson looking at inverse matrices introduces the concept of being able to undo a matrix transformation. Learners work with matrices with a determinant...
Virginia Department of Education
Exponential Modeling
Investigate exponential growth and decay. A set of six activities has pupils collecting and researching data in a variety of situations involving exponential relationships. They model these situations with exponential functions and solve...
EngageNY
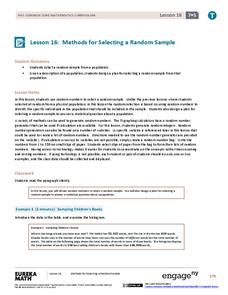
Methods for Selecting a Random Sample
Random sampling is as easy as choosing numbers. Teams use random numbers to create a sample of book lengths from a population of 150 books. The groups continue by developing a technique to create samples to compare from two populations...
Virginia Department of Education
Linear Modeling
An inquiry-based algebra lesson explores real-world applications of linear functions. Scholars investigate four different situations that can be modeled by linear functions, identifying the rate of change, as well as the strength and...
EngageNY
Understanding Box Plots
Scholars apply the concepts of box plots and dot plots to summarize and describe data distributions. They use the data displays to compare sets of data and determine numerical summaries.
Radford University
Connecting Scatter Plots and Correlation Coefficients Activity
Collect a variety of bivariate data. Groups determine sets of data that would provide a positive, negative, and no correlation. Team members gather their data through out the week. Scholars plot the data and determine the relationship...
Virginia Department of Education
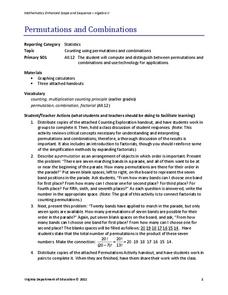
Permutations and Combinations
Counting is not all it adds up to be — sometimes it involves multiplying. The instructional activity introduces permutations and combinations as ways of counting, depending upon whether order is important. Pupils learn about factorials...
Mt. San Antonio Collage
Quiz 2: Types of Functions
Here is a resource that provides the structure of an assessment with the convenience of a full answer key. The focus is on rational, exponential, and logarithm functions with a few questions on solving polynomials.
EngageNY
Comparison Shopping—Unit Price and Related Measurement Conversions II
Which rate is greater and by how much? Pupils continue to compare rates to solve problems in the 20th portion of a 29-part series. Rates are presented in a variety of representations either using the same representation or different...


