Mascil Project
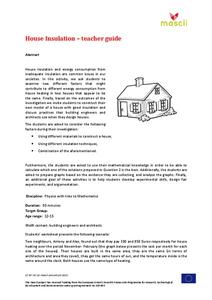
House Insulation
Make sure your house is warm in the winter. Pupils analyze graphs of heating costs for two similar houses and make hypotheses for why the costs differ. They then build models of houses with appropriate insulation to reduce heating costs.
EngageNY
Interpreting Correlation
Is 0.56 stronger than -0.78? Interpret the correlation coefficient as the strength and direction of a linear relationship between two variables. An algebra lesson introduces the correlation coefficient by estimating and then calculating it.
Curated OER
Measurement and Algebraic Thinking
Comparatively speaking, does a bug travel farther than a human in 10 seconds? Get a bug and measure how far it travels in 10 seconds. Have a human team member run for 10 seconds and calculate the distance ran. Answer the question,"Who...
EngageNY
Modeling a Context from a Verbal Description (part 1)
When complicated algebraic expressions are involved, it is sometimes easier to use a table or graph to model a context. The exercises in this lesson plan are designed for business applications and require complex algebraic expressions.
Teach Engineering
Edible Rovers (High School)
Design and build a rover ... then eat it? This activity has groups of two design and build Mars rovers. The teams determine what instruments they want to include with their rover and plan a budget. They calculate the cost of the body of...
Radford University
Projectile Motion and Quadratic Functions
Model the flight of a ball. Small groups collect time data for how long it takes to toss a ball between two people. The teacher leads a discussion about projectile motion to get the class thinking about how to calculate the equation of...
National Wildlife Federation
Wherefore Art Thou, Albedo?
In the sixth lesson in a series of 21, scholars use NASA data to graph and interpret albedo seasonally and over the course of multiple years. This allows learners to compare albedo trends to changes in sea ice with connections to the...
Virginia Department of Education
Analyzing and Interpreting Statistics
Use measures of variance to compare and analyze data sets. Pupils match histograms of data sets to their respective statistical measures. They then use calculated statistics to further analyze groups of data and use the results to make...
EngageNY
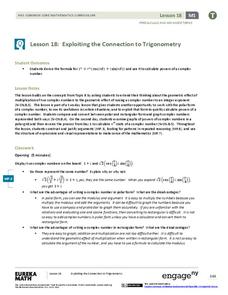
Exploiting the Connection to Trigonometry 1
Class members use the powers of multiplication in the 19th installment of the 32-part unit has individuals to utilize what they know about the multiplication of complex numbers to calculate the integral powers of a complex number. Groups...
Shodor Education Foundation
Sequencer
Take the first step into graphing sequences. Learners set the starting number, multiplier, add-on, and the number of steps for a sequence. Using the inputs, the interactive calculates and plots the sequence on the coordinate plane. Users...
Curated OER
Exponential Functions
Your algebra learners analyze and interpret the general form and the graph of two functions. The increase of the function due to the multiplicative factor is emphasized.
Illustrative Mathematics
Chicken and Steak, Variation 2
Many organizations put on barbecues in order to make money. In a real-world math problem, the money allotted to purchase steak and chicken at this barbecue is only one hundred dollars. It is up to your potential chefs to figure out how...
Howard County Schools
Drawing Inverses
An Algebra II lesson draws the connection between the exponential function and its inverse. By graphing an exponential function and using tables and a calculator, students graph the logarithmic function. The plan comes with a launch,...
UAF Geophysical Institute
Carbon Footprint
Your young environmentalists can calculate their carbon footprint and discuss ways to reduce it with a worksheet about climate change. After reading a handout about what impact one's carbon footprint can have on the environment, kids...
Teach Engineering
Density Column Lab - Part 2
Groups suspend objects within layers of liquids to determine the densities of different liquids and compare them to the densities of objects calculated in Part 1. The groups then carefully test their calculations by layering the liquids...
Radford University
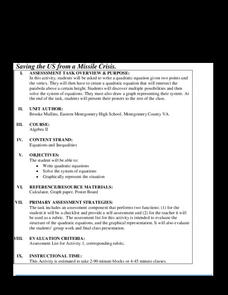
Saving the US from a Missile Crisis
Mathematically shoot down an incoming missile. Given information about the Cuban Missile Crises, learners calculate the equation of the trajectory of an imaginary missile launched from Cuba toward Washington, D.C. Scholars determine the...
Shodor Education Foundation
Box Plot
What information can come from a box? Learners choose a data set to display as a box plot and decide whether to include the median in the calculation of the quartiles, show the outliers, and change the scale. To finish the lesson,...
Teach Engineering
Quantum Dots and Colors
Introduce teams to quantum dot solutions with an activity that has them expose solutions to a blacklight, observe the colors, and take measurements. Groups graph the data and analyze the dependence between particle size and color...
Radford University
Fuel Efficient Function Activity
Pupils research the five most fuel efficient vehicles of the same type and come up with a way to display the mile per gallon for each vehicle. After choosing a vehicle, scholars create graphs to display miles traveled given the amount of...
Education Development Center
Distance, Rate, and Time—Walking Home
Dig into a classic math problem with your classes. Through an engaging task, learners work with rate and distance information to make conclusions. In the task, two people walk at different rates; one leaves first, and scholars calculate...
Radford University
Finding Slope
The class takes a trip about the school and find four places to measure the rise and run of objects that represent slope in the building. Pairs work together to calculate the slope of each object and determine whether any ramp they find...
Curated OER
Can You Count on Cans?
How can a canned food drive be connected to math? It's as simple as counting and organizing the cans! Children demonstrate their ability to sort non-perishable foods into categories that include soup cans, vegetable cans, boxed items,...
Radford University
Snappy Stair Sprints
Let's go for a run. Small groups determine a way to collect data to determine the time it would take to run a set of stairs. After creating a plan, teams collect data and graph their results, calculating the equation of best fit and...
Teach Engineering
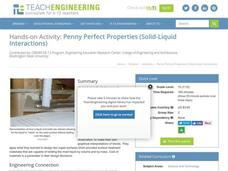
Penny Perfect Properties (Solid-Liquid Interations)
I can get more water to stay on a penny than you can! Collaborative pairs determine the volume of liquids that can be contained on the surface of copper pennies and plastic coins. The pairs analyze their results using graphs and go on to...
Other popular searches
- Graphing Calculator and Math
- Algebra Graphing Calculators
- Graphing Calculator Math
- Graphing Calculator Skills
- Graphing Calculator Squares
- Graphing Calculator Lessons
- Graphing Calculator Parabola
- Graphing Calculators Ti 83
- Graphing Calculator Activities
- Graphing Calculator Worksheet
- Ti 84 Graphing Calculator


