American Statistical Association
What Fits?
The bounce of a golf ball changes the result in golf, mini golf—and a great math activity. Scholars graph the height of golf ball bounces before finding a line of best fit. They analyze their own data and the results of others to better...
BW Walch
Creating and Graphing Exponential Equations
Frequently found in biology and economic application problems, exponential equations show up as stars in this introductory presentation. Taking no background or knowledge of exponentials for granted, the slides walk learners through the...
Curated OER
Exponential Growth versus Linear Growth II
Your algebra learners discover that exponential functions, with a base larger than one, outgrow linear functions when the inputs increase sufficiently. Their analysis includes using a graphing calculator to produce tables.
Curated OER
A Sum of Functions
Collaborative learners will see the geometric addition of functions by graphing the sum of two graphed curves on the same coordinate plane. This task then naturally flows into giving learners the algebraic representation of the curves...
Beyond Benign
Municipal Waste Generation
Statistically, waste may become a problem in the future if people do not take action. Using their knowledge of statistics and data representation, pupils take a look at the idea of waste generation. The four-part unit has class members...
Curated OER
Classroom Supplies
Challenge young mathematicians to buy classroom supplies by staying within the means of a $1,000 budget. The mathematical activity provides learners with the opportunity to decide what items from the supply list would benefit a class of...
Curated OER
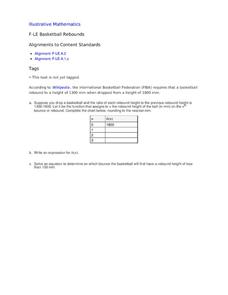
Basketball Rebounds
Your young basketball players will build a table and develop a general formula for a decaying exponential scenario involving the rebound distance of a bouncing ball. Using a CBR and graphing calculator can make this even more hands-on...
Virginia Department of Education
Box-and-Whisker Plots
The teacher demonstrates how to use a graphing calculator to create box-and-whisker plots and identify critical points. Small groups then create their own plots and analyze them and finish by comparing different sets of data using box...
NASA
Next Generation Spacecraft—Orion
What is the cross-sectional area of the Orion spacecraft? Groups work together to estimate the area of a cross section of the Orion spacecraft by first counting the number of grids a scale drawing covers. Pupils also employ a method...
Shodor Education Foundation
InteGreat
Hands-on investigation of Riemann sums becomes possible without intensive arithmetic gymnastics with this interactive lesson plan. Learners manipulate online graphing tools to develop and test theories about right, left, and midpoint...
NOAA
A Matter of Density
Larvae transportation on the New England seamounts is based on the density of the water. Scholars calculate density and graph salinity versus temperature to better understand the distribution of organisms in a water column. Discussions...
NASA
Lunar Rover
What is the shortest distance/time needed to complete a mission? Groups devise a strategy in order to determine the shortest distance and time connecting two points and a segment. They then use graphing, the distance formula, and a...
Curated OER
Building a Quadratic Function Form
Comparing the movement of graphs geometrically when small changes are made to the parent function motivates this collaborative discussion on the transformations of functions to their various forms. Vertical and horizontal shifts due to...
EngageNY
The Binomial Theorem
Sometimes, there is a better way. Scholars develop Pascal's triangle as a method to arrive at the coefficients of binomial expansions as an easier method to expand binomials. The learners connect the formula for binomial coefficients to...
NASA
Space Shuttle Ascent: Altitude vs. Time
How long did it take to get to that altitude? Using a Google Earth file, groups explore a space shuttle launch. Using a calculator, groups determine the function that models the altitude/time data from an actual launch. With the model in...
Teach Engineering
Determining Densities
Don't be dense—use a robust resource. The second installment of a five-part Floaters and Sinkers unit has learners determine the densities of several objects. As part of the activity, they learn the displacement method for finding...
Mt. San Antonio Collage
Quiz 1: Functions, Domain and Range
Take the work out of worksheets and use these problems and worked-out answer key as a resource. The problems reinforce skills in domain and range, identifying graphs, and even and odd functions.
Radford University
Are You Faster than Bacteria?
Just how fast does bacteria grow? Over the course of three lessons, pupils investigate exponential growth with the use of bacteria growth. During the lesson, bacteria from a cell phone is grown to make a connection to real life. Using...
Natinal Math + Science Initative
Slope Investigation
Context is the key to understanding slope. A real-world application of slope uses a weight loss scenario with a constant rate of change to introduce the concept of slope of a line, before it makes a connection to the ordered pairs and...
Virginia Department of Education
Organizing Topic: Data Analysis
Learners engage in six activities to lead them through the process of conducting a thorough analysis of data. Pupils work with calculating standard deviations and z-scores, finding the area under a normal curve, and sampling techniques....
National Security Agency
What’s Your Coordinate?
Your middle schoolers will show what they know with their bodies when they become the coordinate plane in this conceptual development unit. Starting with the characteristics of the coordinate plane, learners develop their skills by...
Fall River Schools
Parabolas Are All Around Us
Moving parabolas off of graph paper and into the real world is the task at hand in this detailed poster project. First, learners perform a cumulative activity identifying many characteristics of an assigned quadratic equation. Next, they...
NASA
Earth, Can You Hear Me Now?
How long did you say? Class groups plot the distances between Earth and Mars and determine the trigonometric function that models the data. Using a calculator, they graph the function to determine when the distance and communication...
Point Pleasant Beach School District
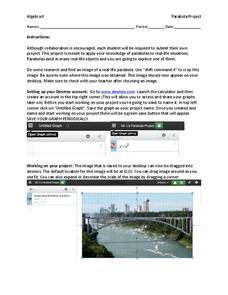
Parabola Project
Class members select a picture that contains a parabola and construct a drawing of it using function graphs in the quadratic project. Individuals restrict the domains of the functions to create a more accurate drawing. They then submit a...
Other popular searches
- Graphing Calculator and Math
- Algebra Graphing Calculators
- Graphing Calculator Math
- Graphing Calculator Skills
- Graphing Calculator Squares
- Graphing Calculator Lessons
- Graphing Calculator Parabola
- Graphing Calculators Ti 83
- Graphing Calculator Activities
- Graphing Calculator Worksheet
- Ti 84 Graphing Calculator


