Radford University
Transformational Graphing in the Real World: Building Bridges
No suspension here, the resource is good to go. Using graphing calculators, scholars explore how transformations affect the graphs of quadratic functions. They consider how the changes relate to the context of suspension bridges.
Radford University
Transformational Graphing in the Real World: Air Traffic Control
You're cleared to learn about absolute value functions. An interesting lesson has scholars investigate transformations of the graphs of absolute value functions. They look at air traffic control as an application of the concept.
NASA
Cloudy vs. Clear - Graphs
Explore the link between solar energy and cloud cover using real data from NASA from China! Future climatologists analyze and interpret graphs of solar energy on clear and cloudy days using a literacy cube. Investigators draw conclusions...
Curated OER
Your Tax Dollars at Work
In order to understand how tax dollars are spent, young economists use given data and graph it on a circle graph. Circle graphs are highly visual and can help individuals describe data. A class discussion follows the initial activity.
Curated OER
Ice Cream Lab
I scream, you scream, we all scream for ice cream! Even high schoolers enjoy making ice cream. This laboratory exercise has them record the temperature changes throughout the process of liquid becoming solid, graph the results, and...
Curated OER
Race, Education, and Income: Comparing Carter & Reagan
High school learners compare economic outcomes for 3 racial groups under the presidencies of Jimmy Carter and Ronald Reagan by analyzing a series of graphs, answering questions from a worksheet, and participating in a discussion.
Curated OER
Classroom Supplies
Challenge young mathematicians to buy classroom supplies by staying within the means of a $1,000 budget. The mathematical activity provides learners with the opportunity to decide what items from the supply list would benefit a class of...
National Security Agency
Line Plots: Frogs in Flight
Have a hopping good time teaching your class how to collect and graph data with this fun activity-based lesson series. Using the provided data taken from a frog jumping contest, children first work together creating a line plot of the...
School Improvement in Maryland
Demographic Investigation
What are the factors that influence voting patterns? How do these factors influence government funding? Is participation the squeaky wheel gets the grease? Class members interpret graphs and analyze trends to determine what demographic...
NASA
Weightless Wonder
A video of the weightless wonder provides a setting for the math to follow. Groups analyze the graph of a quadratic function that models the path of the C-9 as it gives astronauts the experience of weightlessness. Using a graphing...
NASA
Space Shuttle Ascent: Mass vs. Time
Set the stage for groups of rocket scientists to explore the change in mass of the space shuttle during ascent. Teams work together to graph actual launch data in order to determine the rate of propellent burn.
Museum of Tolerance
Why is This True?
Are wages based on race? On gender? Class members research wages for workers according to race and gender, create graphs and charts of their data, and compute differences by percentages. They then share their findings with adults and...
Mathematics Assessment Project
Representing Quadratic Functions Graphically
Sometimes being different is an advantage. An engaging activity has scholars match cards with quadratic functions in various forms. Along the way, they learn about how each form highlights key features of quadratic functions.
EngageNY
Waves, Sinusoids, and Identities
What is the net effect when two waves interfere with each other? The lesson plan answers this question by helping the class visualize waves through graphing. Pupils graph individual waves and determine the effect of the interference...
Shodor Education Foundation
Plop It!
Build upon and stack up data to get the complete picture. Using the applet, pupils build bar graphs. As the bar graph builds, the interactive graphically displays the mean, median, and mode. Learners finish by exploring the changes in...
Shodor Education Foundation
Polar Coordinates
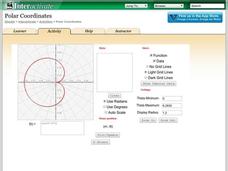
Polar opposites might not work together—but polar coordinates do! The interactive provides learners the opportunity to graph trigonometric and algebraic functions using polar coordinates. The program takes either individual data points...
Exploratorium
Traveling Networks
Show your class the path to understanding graph theory. Scholars learn about basic graph theory using an activity based on the Bridges of Konigberg problem. They draw networks on the playground and decide whether it is possible to travel...
NOAA
A Matter of Density
Larvae transportation on the New England seamounts is based on the density of the water. Scholars calculate density and graph salinity versus temperature to better understand the distribution of organisms in a water column. Discussions...
Mathematics Vision Project
Module 4: Linear and Exponential Functions
Sequences and series are traditionally thought of as topics for the pre-calculus or calculus class, when learners are figuring out how to develop limits. But this unit uses patterns and slopes of linear functions in unique ways to bring...
American Statistical Association
What Fits?
The bounce of a golf ball changes the result in golf, mini golf—and a great math activity. Scholars graph the height of golf ball bounces before finding a line of best fit. They analyze their own data and the results of others to better...
Creative Learning Exchange
Lesson Plans From The Lorax
When it comes to the environment, no variable is constant. Class members graph behavior over time for the thneeds produced over truffula trees chopped down over the course of Dr. Seuss's The Lorax.
Radford University
How do I Choose the Most Cost Efficient Scooter Rental Plan for My Family?
Pupils compare the cost of renting scooters for a family vacation from three different rental places. To help make their decision, scholars create tables, equations, and graphs of the pricing structure. Individuals then determine which...
NASA
The Big Climate Change Experiment Lesson 3: Climate Change Lines of Evidence
Consider the preponderance of evidence when making a verdict. The third of five lessons in Unit 1: The Big Climate Change Experiment focuses on the evidence for climate change. Learners study graphs, diagrams, and pictures regarding...
K20 LEARN
Comparing Numbers And Fruit—More Or Less: Comparing Numbers
A discussion begins a lesson on comparing numbers. Pupils explain how they can show a number, then visit math centers to explore number-making tools. A story read-aloud of More or Less by Stuart Murphy identifies language for comparing...
Other popular searches
- Coordinate Graphing Pictures
- Graphing Ordered Pairs
- Graphing Skills Lesson Plans
- Coordinate Graphing
- Graphing Linear Equations
- Holiday Coordinate Graphing
- Graphing Linear Inequalities
- Graphing Calculator
- Graphing Inequalities
- Halloween Math Graphing
- Graphing Mean, Median, Mode
- Graphing Data


