Inside Mathematics
Population
Population density, it is not all that it is plotted to be. Pupils analyze a scatter plot of population versus area for some of the states in the US. The class members respond to eight questions about the graph, specific points and...
Concord Consortium
Acid Test
This isn't your typical basic lesson—it's more acidic! Learners use pH information to determine the hydroxide ion concentration of different substances and then use these values to analyze information. The calculations require...
Howard County Schools
To Babysit or Not to Babysit?
Would you work for a penny today? Use this activity to highlight the pattern of increase in an exponential function. Scholars compare two options of being paid: one linear and one exponential. Depending on the number of days worked, they...
Teach Engineering
Energy on a Roller Coaster
Roll with your class into the idea of conservation of energy. Pupils use a roller coaster track to collect data to reinforce the concept of conservation of energy and the influence of friction. Class members then create a graph from...
Virginia Polytechnic Institute and State University
Lesson Plan: Omelet Cooking Principles
Although designed for a foods lab, the information in this resource might be just the thing for your own recipe notebook. Illustrated, step-by-step directions for making the perfect omelet, egg-citing puzzles, games, and even...
Concord Consortium
Heights and Weights
Height is dependent on weight—or is it the other way around? Given data from a physicians handbook, individuals compare the height and weight of males and females at different areas. They calculate differences and ratios to assist with...
Curated OER
Maglev Train
In this statistics instructional activity, learners collect data on train time using speed and time. They differentiate between the upper and lower bound of their data. There are 7 questions on 2 pages.
National Council of Teachers of Mathematics
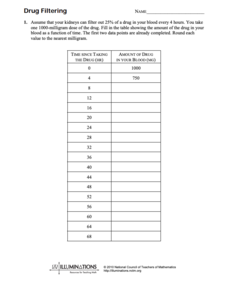
Drug Filtering
In this chemistry instructional activity, learners calculate the amount of drug found in someones blood based on how long they have been taking the drug. There are 5 questions.
Curated OER
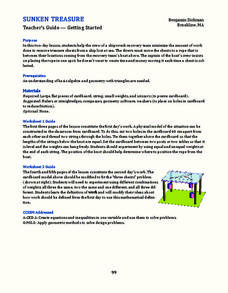
Sunken Treasure
You've located buried treasure, now what? Explore how to use algebraic and geometric methods to determine where to place a recovery ship based on the location of the treasure.
Inside Mathematics
Snakes
Get a line on the snakes. The assessment task requires the class to determine the species of unknown snakes based upon collected data. Individuals analyze two scatter plots and determine the most likely species for five additional data...
Inside Mathematics
Expressions
Strive to think outside of the quadrilateral parallelogram. Worksheet includes two problems applying prior knowledge of area and perimeter to parallelograms and trapezoids. The focus is on finding and utilizing the proper formula and...
Inside Mathematics
Graphs (2006)
When told to describe a line, do your pupils list its color, length, and which side is high or low? Use a worksheet that engages scholars to properly label line graphs. It then requests two applied reasoning answers.
Mathed Up!
Stratified Sampling
Young mathematicians learn how to solve problems involving stratified sampling. They review concepts of sampling and proportionality by watching a video and then they complete a learning exercise of questions on this topic.
Curated OER
Exercise Set 2.6: An Introduction to Functions
In this functions activity, students solve 70 short answer questions. Students find domain of functions and evaluate them for a given value. Students determine if a mapping diagram represents a function.
02 x 02 Worksheets
Absolute Value Equations and Inequalities
Demonstrate the meaning of an absolute inequality using three different methods. Here, scholars explore absolute value inequalities through graphing, number line distance, and compound inequalities. Pupils complete various activities to...
Western Kentucky University
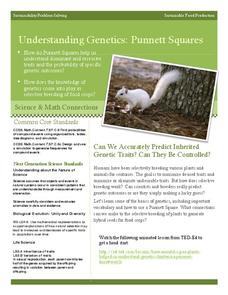
Understanding Genetics: Punnett Squares
Can scientists really predict genetic outcomes or are they simply making a lucky guess? Scholars first learn about Gregor Mendel and how to make Punnett squares. Then they extract DNA from a strawberry in a lab with included conclusion...
Balanced Assessment
Egyptian Statue
Investigate the proportional relationships of length, area, and volume. Learners use the dimensions of rectangular prisms to create ratios and proportions. They compare the different ratios to solve more advanced problems.
Illustrative Mathematics
Modeling London's Population
Looking at London's population from 1801–1961 in 20 year increments, high school mathematicians determine if the data can be modeled by a given logistic growth equation. They explain their thinking and determine the values of each...
Helping with Math
Ratio and Proportion: Simplifying Ratios (2 of 2)
In this assignment, math stars simplify ratios. The first half just displays numbers, whereas the second half describes real-world scenarios with ratios to be written and reduced. The publisher mentions CCSS.Math.Content.6.RP.3, but it...
Curated OER
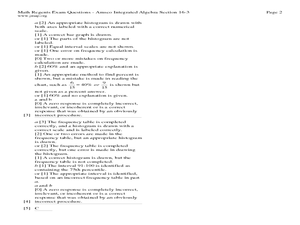
The Histogram
In this Algebra I/Algebra II instructional activity, students construct and analyze histograms to develop a visual impression of the distributions of data. The two page instructional activity contains five problems. Answer key is...
Curated OER
Mendel's Laws of Heredity
In this heredity worksheet, students will review the work Mendel did on predicting how traits were passed down from generation to generation. Then students will review monohybrid and dihybrid crosses and Punnett squares. This worksheet...
Curated OER
Mass Spectrometer
In this mass spectrometer worksheet, students read about how a mass spectrometer determines the elements in gases around Earth. Students answer 3 questions and identify the elements in a graph found by a mass spectrometer.
Helping with Math
Ratio and Proportion: Simplifying Ratios (1 of 2)
Here is a set of 24 pairs of numbers for which kids reduce the ratios to their simplest form. It is a simple and straightforward assignment, meant by the publisher to address CCSS.Math.Content.6.RP.3. Note, however, that it only requires...
Curated OER
Estimating the Mile Record
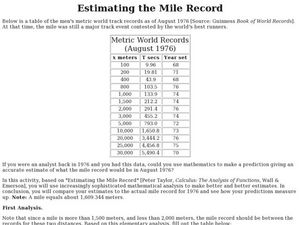
In this estimating the mile record, students examine given data. They use create a box-and-whisker plot to determine the upper and lower quartiles of the data. This one-page activity contains 1 multi-step problems.


