Curated OER
Graph It!
There is more than one way to represent data! Learners explore ways to represent data. They examine stacked graphs, histograms, and line plots. They conduct surveys and use stacked graphs, histograms, or line plots to chart the data they...
Balanced Assessment
Movie Survey
Movie preferences will get your classes talking! Individuals read a pie graph and construct a bar graph using the same information. They then answer questions specific to the data and sample size.
Beyond Benign
Municipal Waste Generation
Statistically, waste may become a problem in the future if people do not take action. Using their knowledge of statistics and data representation, pupils take a look at the idea of waste generation. The four-part unit has class members...
Curated OER
Bar Graphs
Students perform operations and graph their data using charts and bar graphs. In this algebra lesson, students follow specific steps to make a bar graph. They create a survey about people favorite things and plot their data from the...
Curated OER
A Thanksgiving Survey
Students conduct a survey. In this math lesson, students design and conduct a survey about Thanksgiving foods. Students display the collected data in a graph and use the graph to determine what food to serve for a Thanksgiving meal.
Curated OER
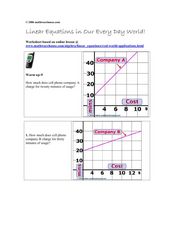
Linear Equations in Our Every Day World!
In this linear equations instructional activity, students read and interpret graphed linear equations. They read a story problem, write a linear equation, and plot the points on a coordinate plane. This five-page instructional activity...
Curated OER
New Kids in The Hall
Students assess the role of statistics in determining those athletes chosen to be inducted into the Baseball Hall of Fame. They work in small groups to calculate, chart, and graph various statistics for different Hall of Fame members.
Curated OER
What Did It Cost 100 Years Ago?
Students compare prices of good across the century in order to introduce the topic of inflation. They undertand the concepts of inflation and Consumer Price Index (CPI), use online calculators to figure the approximate cost of goods...
Curated OER
Lesson 6-7: Scatter Plots and Equations of Lines
In this scatter plot worksheet, students examine tables and write a linear equation that matches the table. Students graph linear equations. They read scatter plots, determine the trend line, and write a linear equation to match...
Curated OER
Lines of Fit
Students graph an equation and analyze the data. In this algebra lesson plan, students graph scatter plots and identify the line of best fit using positive correlation, negative correlation an d no correlation. They apply their data...
Balanced Assessment
Stock Market
Analyze trends in the stock market using histograms. Future economists use data presented in a histogram to find periods of greatest increase and decrease. They also draw conclusions about days that would be best to invest.
Mathed Up!
Frequency Polygons
Frequency polygons are a different way to represent frequencies over intervals. Pupils take frequencies for intervals of data from a frequency table and plot them as a frequency polygon. Budding mathematicians find information about the...
Curated OER
Count The Letters
Students perform activities involving ratios, proportions and percents. Given a newspaper article, groups of students count the number of letters in a given area. They use calculators and data collected to construct a pie chart and bar...
Curated OER
Popcorn Geography
Students use kernels to create a "Top Corn-Producing States" map or graph. They read and round off numbers. Students identify on a U.S. outline map the location of corn-growing states. They create a visual (map or graph) illustration...
Curated OER
Interpreting Data and Statistics
Students define terms and analyze data. In this statistics lesson, students plot their data using bar and line graphs. They analyze their data after they graph it and apply the results to the Great Depression.
Curated OER
Flight of Angles of Inclination
Students measure the flight of a gilder. In this fight of angles lesson, students explore the flight of a glider and measure the distance flown. They collect statistical data of the flights and determine the slope of each flight. ...
West Contra Costa Unified School District
Talking About Distance, Rate and Time
Connect the tortoise and the hare fable to mathematics. Learners first identify key terms related to distance, rate, and time. They then solve distance/rate/time problems using different representations.
Curated OER
Introducing Linear Terminology
Ninth graders graph linear equations and inequalities in two variables and then, they write equations of lines and find and use the slope and y-intercept
of lines. They use linear equations to model real data and define to define the...
Curated OER
Find That Bargain!
Learners explore the methods of calculating percentages, reading and the construction of graphs, and an awareness of consumer concerns in this instructional activity. The movement of the decimal point often results in uncertainty and...
Curated OER
Tracking Your Favorite Web Sites
Ninth graders track the hit count on their favorite web sites. In this Algebra I instructional activity, 9th graders record the number of hits on their favorite web site for twenty days. Students explore the data to determine if the...
Curated OER
Expected Outcome
Students determine expected values of experiments and explore distributions of experiments. They guess as to how many times a coin will flip heads in fifty tries. They flip a coin fifty times graphing the results on a histogram. They...
Curated OER
Temperature Comparisons
Students practice plotting temperature data points on a line graph in groups and examine the temperature differences at the same time of year. They graph the temperatures in Lannon, WI, and Mitchell's Plain, SA. After the data has been...
Curated OER
Active Learning
Students practice using measurements and bar graphs to solve a running problem in this active Math lesson for various age levels. The lesson meets state standards in Mathematics and requires the use of "math journals" for final...
Curated OER
Studying Checks
While on-line banking and electronic payments seem to be the way of the future, next-generation wage earners still need to understand the details of check writing. Here the focus is on the details of the check including what the...


