EngageNY
Graphing the Tangent Function
Help learners discover the unique characteristics of the tangent function. Working in teams, pupils create tables of values for different intervals of the tangent function. Through teamwork, they discover the periodicity, frequency, and...
Willow Tree
Bar Graphs
Circles, lines, dots, boxes: graphs come in all shapes in sizes. Scholars learn how to make a bar graph using univariate data. They also analyze data using those bar graphs.
Futures Channel
Folding Circles
Students investigate properties of circles. In this geometry lesson, students differentiate between similarity and congruence as they observe polygons. They investigate properties of two and three dimensional shape.
Curated OER
Discovering Pi/Welcome to Pi Day
Students explore pi. In this circle measurement lesson, students define and identify radius, diameter, circumference, and perimeter. Students work in groups to measure several plastic lids and record their findings. Students compare the...
Mathematics Assessment Project
Sorting Equations of Circles 2
How much can you tell about a circle from its equation? This detailed lesson plan focuses on connecting equations and graphs of circles. Learners use equations to identify x- and y-intercepts, centers, and radii of circles. They also...
EngageNY
Graphing Systems of Equations
Expand on learners' understanding of quadratic-linear systems. Building on the graphic understanding developed in the previous lesson, pupils learn algebraic methods of solving the systems.
Willow Tree
Histograms and Venn Diagrams
There are many different options for graphing data, which can be overwhelming even for experienced mathematcians. This time, the focus is on histograms and Venn diagrams that highlight the frequency of a range of data and overlap of...
EngageNY
Why Call It Tangent?
Discover the relationship between tangent lines and the tangent function. Class members develop the idea of the tangent function using the unit circle. They create tables of values and explore the domain, range, and end behavior of the...
Mt. San Antonio Collage
Quiz 1: Types of Functions
Sometimes the best things are already done for you! Here is a six-problem quiz that has a variety of problems ranging from solving quadratic equations to interpreting a function. The piece-de-resistance is the worked out answer key in...
Curated OER
Reading Graphs
Students read graphs and charts to interpret results. In this algebra lesson, students interpret bar, line and pictographs. They draw conclusions and make predicitons based on these charts.
Curated OER
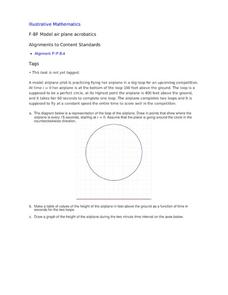
Model Air Plane Acrobatics
Your young airplane enthusiasts will enjoy this collaborative task of graphing an airplane's distance from the ground as it flies in a perfect circle. They will discover that they have graphed a sinusoidal function that comes from the...
Curated OER
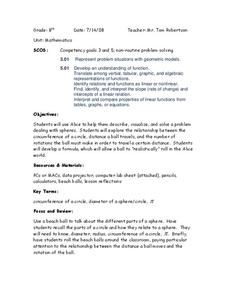
Circle Relationships
Students explore circles. In this geometry lesson plan, students explore the relationship between the circumference of a circle, the distance a ball travels, and the number of rotations the ball must make in order to travel a certain...
Curated OER
Discovering Pi
Define terminology related to a circle. Practice accuracy in measuring and then create a spreadsheet based on data collected from solving for parts of a circle. Groups can have fun analyzing their data as it relates to Pi.
West Contra Costa Unified School District
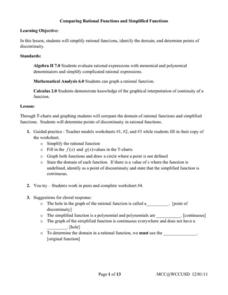
Comparing Rational Functions and Simplified Functions
What kind of functions have holes in their graphs? Here, the teacher guides the class on how to use the simplified function of a rational function to aid in the graphing of the original rational function. T-tables are used in order to...
Bowland
Fruit Pies
Scholars use formulas for the area of a circle and the area of a rectangle to determine the number of pies a baker can make from a particular area of dough. They must also take into account rolling the remaining dough into a new sheet.
EngageNY
Polynomial, Rational, and Radical Relationships
This assessment pair goes way beyond simple graphing, factoring and solving polynomial equations, really forcing learners to investigate the math ideas behind the calculations. Short and to-the-point questions build on one another,...
Curated OER
Finding PI
Students select and use appropriate operations, methods and tools to compute or estimate using whole numbers. They develop and use formulas for determining the circumference and area of circles. Students determine and describe the...
Curated OER
Hyperbolas: Sketching from the Equation
In this algebra worksheet, young scholars sketch graphs of hyperbolas after solving equations to standard form and interpreting the center, vertices, foci, axis, asymptotes, and eccentricity from the equation. There are 58 questions.
CCSS Math Activities
Out of the Swimming Pool
Out of the swimming pool and into the math classroom! Young mathematicians analyze two linear functions representing the number of liters of water in a pool as it drains over time. They must evaluate functions, interpret function...
Curated OER
Round and Round and Round We Go!
Students investigate motion using a CBL. In this algebra lesson, students collect and graph data on a coordinate plane. They define and identify amplitude and period of conic graphs.
Curated OER
Orbital Bliss
Most young mathematicians are aware that the planets don’t orbit the sun in a circle but rather as an ellipse, but have never studied this interesting feature. This resource looks at the planetary orbits in more detail and helps learners...
Curated OER
Trigonometry
Students investigate angles converting them from radians to degrees. In this trigonometry lesson, students work with angles and the six different trig ratios. They graph the functions representing each trig functions and identify the...
Curated OER
Woody Sine
Students explore the concept of sine. In this sine lesson, students create a sine graph from tooth picks. Students create a unit circle with tooth pick length radius. Students then take the tooth picks from the unit circle and put them...
Curated OER
Whose Line is it Anyway?
Students solve systems of equations. In this algebra lesson, students identify the domain and range of each function. They use the slope and y-intercept to graph each line.


