Mathematics Vision Project
Module 9: Modeling Data
How many different ways can you model data? Scholars learn several in the final module in a series of nine. Learners model data with dot plots, box plots, histograms, and scatter plots. They also analyze the data based on the data...
West Contra Costa Unified School District
Quadratic Equations — What We Know
Everything you could possibly want to know about quadratic equations, all in one resource. Instructors demonstrate how to translate between different forms of quadratics (equation, table of values, graph, verbal description) and finding...
Charleston School District
Review Unit 4: Linear Functions
It's time to show what they know! An assessment review concludes a five-part series about linear functions. It covers all concepts featured throughout the unit, including linear equations, graphs, tables, and problem solving.
Willow Tree
Graphing
So many methods and so little time! The efficient method of graphing a linear equation depends on what information the problem gives. Pupils learn three different methods of graphing linear equations. They graph equations using...
West Contra Costa Unified School District
Multiple Representations of Equations
class members first work through finding the equation, table of values, graph, and key features of a linear function expressed verbally. Individuals then work through several more problems given different representations.
Project Maths
Introduction to Patterns
The world is full of patterns. Help learners quantify those patterns with mathematical representations. The first Algebra lesson in a compilation of four uses a series of activities to build the concept of patterns using multiple...
5280 Math
Factory Functions
Solve a real-life problem using function-building skills. Presented with an open-ended question, scholars complete a checklist to create and justify a solution in an interesting algebra project. The checklist asks for justifications of...
Curated OER
The Periodic Table
Eighth graders read and interpret the Periodic Table. They also make decisions on how to group and arrange different kinds of matter and draw the structure of atoms of pure elements. Finally, 8th graders contrast and compare basic...
Math Mammoth
Decimal Problems
In this math worksheet, students are given tables and story problems with decimal points. Students must use the tables and story problems to find 10 answers about the data.
Curated OER
Challenge Time Problems
In this time problems activity, 8th graders solve and complete 6 different problems that include filling in data and responding to short answer questions about time. First, they determine the number of hours each child in the table...
Curated OER
Froot Loop Favorites
In this Froot Loop favorites worksheet, students solve and complete 3 different problems that include data tables related to their Froot Loop favorites. First, they determine what fraction of the class voted for each color listed in the...
Curated OER
Froot Loops to the Max - Predictions and Weighing
In this prediction and weighing worksheet, learners complete and solve 5 problems related to a box of Froot Loops cereal. First, they complete the table with the data each team finds with their box of cereal. Students determine the...
Utah Education Network (UEN)
Finding Slope of a Line from Graphs, Tables, and Ordered Pairs
Middle schoolers explore the concept of slope in numerous ways and start to look at simple linear equations. They describe the slope in a variety of ways such as the steepness of a line, developing a ratio, using graphs, using similar...
Illustrative Mathematics
US Garbage, Version 1
An interesting example of a discrete function and how it is applies to the real world. This could easily make a good collaborative lesson with an environmental science class. Practice reading a table and drawing a scatter plot make up...
Curated OER
Graphs and Functions
Middle schoolers describe plotting functions on the Cartesian coordinate plane. They solve functions on paper and using an online tool to plot points on a Cartesian coordinate plane creating lines and parabolas.
Curated OER
What's in a Graph?
How many yellow Skittles® come in a fun-size package? Use candy color data to construct a bar graph and a pie chart. Pupils analyze bar graphs of real-life data on the Texas and Massachusetts populations. As an assessment at the end of...
Curated OER
What is the Best Chip?
Scholars collect data about chips. They pick their favorite type of chip from a given variety such as potato chips, tortilla, or banana chips. Then they write on an index card their favorite chip and why it's their favorite. They also...
Curated OER
How Fast is it Traveling?
Learners calculate the rate of speed of various moving objects within the classroom setting, or outside under a controlled environment.
Math Wire
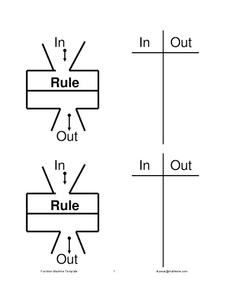
Function Machine
Provide your mathematicians with a way to organize their algebraic functions with this function machine handout. Each sheet provides a place to write down the rule and then either a t-table or full table to organize their input and output.
Curated OER
Data Collection and Presentation
Middle and high schoolers collect and analyze data from four different activities. The activities include information about classmates, tallying colors of cars in a parking lot, stem and leaf plots, and making a histogram from winning...
Illustrative Mathematics
Sammy's Chipmunk and Squirrel Observations
Here is a fun project. Sammy observes a chipmunk and a squirrel to see how many holes each needs in order to stash the same number of acorns. Scholars could find the answer algebraically or create a table to analyze the problem in...
Illustrative Mathematics
Who Has the Best Job?
Making money is important to teenagers. It is up to your apprentices to determine how much two wage earners make with their after school jobs. Participants work with a table, an equation, and a graph and compare the two workers to see...
Mathematics Assessment Project
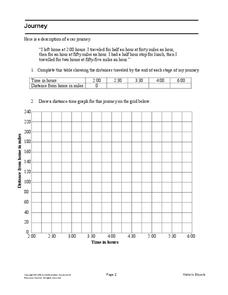
Journey
Drive home math concepts with an engaging task. Learners follow a verbal description to fill in a table and create a distance-time graph representing a car journey. They then answer questions by interpreting the graph.
Charleston School District
Pre-Test Unit 9: Scatter Plots
What do your classes know about statistics? Use a pre-test to determine their background. Topics include scatter plots and lines of best fit, two-way frequency tables, and modeling with linear equations.
Other popular searches
- Multiplication Tables
- Math Tables and Tools
- Function Tables
- Input/output Tables
- Multiplication Tables 1 100
- Frequency Tables
- Input Output Tables
- +Math Tables Tips Tools
- Data Tables
- Tables, Charts and Graphs
- Multiplication Tables Songs
- Frequency Tables Line Plots


