EngageNY
Constant Rate
Two-variable equations can express a constant rate situation. The instructional activity presents several constant rate problems. Pupils use the stated constant rate to create a linear equation, find values in a table, and graph the...
Inside Mathematics
Squares and Circles
It's all about lines when going around. Pupils graph the relationship between the length of a side of a square and its perimeter. Class members explain the origin in context of the side length and perimeter. They compare the graph to the...
5280 Math
Factory Functions
Solve a real-life problem using function-building skills. Presented with an open-ended question, scholars complete a checklist to create and justify a solution in an interesting algebra project. The checklist asks for justifications of...
CCSS Math Activities
Smarter Balanced Sample Items: 8th Grade Math – Target F
Functions model relationships between quantities. The Smarter Balanced sample items demonstrate the assessment strategies for eighth grade function modeling standards. Items range from constructing linear functions from a table and a...
Mathematics Vision Project
Module 9: Modeling Data
How many different ways can you model data? Scholars learn several in the final module in a series of nine. Learners model data with dot plots, box plots, histograms, and scatter plots. They also analyze the data based on the data...
Curated OER
Seized Before Flights: Graph
In this bar graph worksheet, students analyze a graph that show the number of prohibited items intercepted at U.S. airport screening checkpoints. Students answer 3 problem solving questions about the data on the graph.
Mathematics Assessment Project
Matching Situations, Graphs and Linear Equations
What do guitars, candles, and helicopters have in common? They're all in this resource. Learners complete an assessment task to determine the amount of profit made in a guitar class based on given information regarding variable...
Curated OER
Let's Go Slopey
Young scholars create a table of values to graph a line. In this algebra lesson, students identify the slope and intercept of a linear equation. They use a Ticalculator to graph their function.
Illustrative Mathematics
Average Cost
Here is an activity that presents a good example of a function modeling a relationship between two quantities. John is making DVDs of his friend's favorite shows and needs to know how much to charge his friend to cover the cost of making...
Curated OER
Function Tables
Students identify function using tables of data. In this algebra instructional activity, students create a tale of point and plot on a coordinate plane. They analyze the graph as being a function or not.
Curated OER
Generating Points and Graphing
Students create a table of values to help them plot. In this algebra instructional activity, students plot their points on a coordinate plane creating a graph. They observe and analyze linear functions.
Shmoop
Box, Stem-Leaf, and Histogram
A helpful and versatile instructional activity requires young mathematicians to analyze data in order to create graphs and answer questions. Additionally, it prompts learners to find the mean, median, mode, and range of some of the data...
Mathematics Assessment Project
Classifying Solutions to Systems of Equations
Double the fun of solving a linear equation with an activity that asks learners to first compete an assessment task graphing two linear equations to find the common solution. They then complete a card activity solving systems of...
Ohio Department of Education
I Can Do This! Systems of Equations
Use tables, graphs, and substitution to solve systems of linear equations. An envelope of sample problems is passed around the classroom, and each learner has the opportunity to solve the system in the envelope. This is a great way to...
Illustrative Mathematics
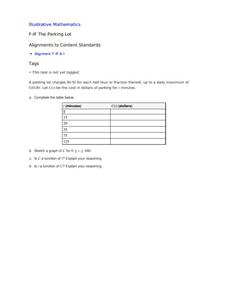
The Parking Lot
Use the real-world cost of parking a car to demonstrate the properties of a function. The resource describes to learners how much it is to park in a certain lot. It is up to your number crunchers to complete a table of minutes and...
Willow Tree
Linear Relationships
There's just something special about lines in algebra. Introduce your classes to linear equations by analyzing the linear relationship. Young mathematicians use input/output pairs to determine the slope and the slope-intercept formula to...
Curated OER
ART PROJECT
Eighth graders, after researching the properties of graphs of conic sections, absolute value and inverse relations, make a drawing of precise functions and relations from a specified list of equations. The final design should analyze the...
Curated OER
Graphing Linear Equations
In this calculator active graphing worksheet, learners graph 12 equations via a calculator and transfer the graphs onto coordinate grids.
Curated OER
Stem and Leaf Tables
In this math worksheet, students examine the order of the data set and create six different stem and leaf tables. The stem is the place value of ten and the leaf is the ones place.
Charleston School District
Pre-Test Unit 3: Functions
How does an input affect an output? Assess your learners' ability to answer this question using this pre-test. Scholars answer questions about the basics of a function. Topics include determining if a table or statement represents a...
Mathematics Vision Project
Module 2: Systems of Equations and Inequalities
The brother-sister pair Carlos and Clarita need your class's help in developing their new pet sitting business. Through a variety of scenarios and concerns presented to the siblings, the learners thoroughly explore systems of equations...
Curated OER
Using Parallel Axes To Discover Mathematical Interconnections
In this math worksheet, young scholars graph the functions on parallel axes and observe the location of the slope point in relation to the x and y axes.
Curated OER
Quantitative Data
In this quantitative data worksheet, pupils compute measures of central tendency, draw vertical line diagrams, and compare collected data. This 23-page worksheet contains approximately 100 multi-step problems. Explanations and examples...
Virginia Department of Education
Road Trip
Help plan a road trip with linear equations. Scholars consider two different rental car companies and write equations representing the cost for each company. They graph the system of equations to determine the conditions under which each...


