Pace University
Grades 7-8 Independent and Dependent Variables
It all depends upon the independence. The differentiated instruction lesson introduces learners to independent and dependent variables. Using real-world situations, scholars gain a conceptual understanding of the difference between the...
Virginia Department of Education
Independent and Dependent Variables
Investigate the relationship between independent and dependent variables. Individuals begin by identifying independent and dependent variables from different problem situations. Then, using specific guidelines, they create posters...
Curated OER
Algebra I: Linear Functions
Using rates from a rental car company, young mathematicians graph data, explore linear relationships, and discuss the role of slope and the y-intercept. This lesson allows for the discussion of independent and dependent variables, as...
Curated OER
Concept: Dependent Events
Middle and high schoolers determine the probability of dependent events. Learners compute both compound and simple probability. This four-page worksheet contains six multi-step problems.
Curated OER
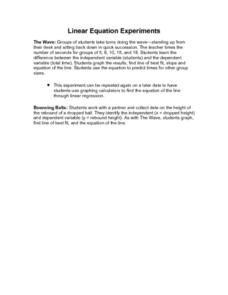
Linear Equation Experiments
For this linear equation worksheet, students solve and complete 2 different experiments that include using linear equations. First, they determine the difference between independent and dependent variables. Then, students graph their...
Curated OER
Walking the Plank
This is a cool math activity. Kids collect and interpret data based on a physical act. A board is balanced between a scale and a step, learners record a peer's weight as it decreases while s/he walks further away from the scale. They...
Shodor Education Foundation
Incline
Study velocity while examining graphical representations. As scholars work with the animation, they discover the effect the height of an incline has on the velocity of the biker. They make conclusions about the slope of the line in terms...
Curated OER
Graphing and Interpreting Linear Equations in Two Variables
Graph linear equations using a table of values. Learners solve equations in two variables using standard form of an equation. They identify the relationship between x and y values.
Curated OER
Probability: Grade A
Math whizzes explore dependent and independent outcomes. They determine the outcome of simple and compound events. Pupils complete tree diagrams to identify outcomes. They identify fair and unfair games. This two-page worksheet contains...
Shodor Education Foundation
Scatter Plot
What is the relationship between two variables? Groups work together to gather data on arm spans and height. Using the interactive, learners plot the bivariate data, labeling the axes and the graph. The resource allows scholars to create...
Curated OER
Independent and Dependent
In this independent and dependent activity, students answer probability word problems dealing with a deck of cards. Students complete 5 problems.
Curated OER
What's Your Shoe Size? Linear Regression with MS Excel
Learners collect and analyze data. In this statistics lesson, pupils create a liner model of their data and analyze it using central tendencies. They find the linear regression using a spreadsheet.
Curated OER
Order of Operations with Variable Expressions
Middle schoolers explore grouping symbols to mathematical equations to discover the importance of the "order of operations." Learners compare the absence of commas in connected text to the absence of grouping symbols in mathematical...
CK-12 Foundation
Understand and Create Line Graphs: Line Graphs
Explore line graphs and their characteristics through an interactive lesson. Scholars follow a set of directions to plot data on a line graph. They then answer questions about the type of variables, minimum and maximum values, and...
Curated OER
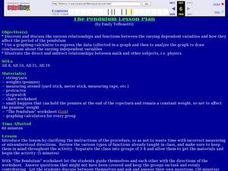
The Pendulum
Middle schoolers discover and discuss relationships and functions between varying dependent variables and how they affect the period of the pendulum. They use graphing calculator to express the data collected in a graph, to analyze the...
Curated OER
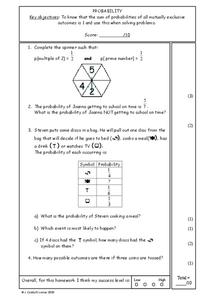
Probability
Middle schoolers explore independent probability. They identify mutually exclusive outcomes. This two-page worksheet contains four multi-step problems.
Curated OER
Probability: Basic Rules of Probability
In this probability worksheet, students determine the probability of independent and dependent events. They complete simple and compound events. This four-page worksheet contains five problems. Answers are provided.
Curated OER
Consistent and Inconsistent Systems
In this consistent and inconsistent systems worksheet, learners solve and complete 24 different problems. First, they solve each given system algebraically. Then, students determine whether each system is dependent, independent, or...
Curated OER
Grasping Graphs
In this grasping graphs worksheet, students solve and complete 3 different types of problems. First, they graph the data described and select the appropriate graph type. Then, students identify the independent and dependent variable. In...
Curated OER
Data Analysis
In this data analysis worksheet, 8th graders solve and complete 4 different problems that include determining the line of best fit for each. First, they write the prediction for an equation for each situation described. Then, students...
Curated OER
Non-Random Variables: NBA Championship
Young scholars demonstrate probability distribution of non-random variables. Students collect data on the NBA Championships. They record the data and compute subsets and permutations.
EngageNY
Linear Models
Expand your pupils' vocabulary! Learn how to use statistical vocabulary regarding linear models. The lesson teaches scholars the appropriate terminology for bivariate data analysis. To complete the module, individuals use linear...
University of Utah
Functions
Define, explore, compare, and analyze functions with the fourth chapter of a 10-part eighth-grade workbook series. After encountering the definition of a function, pupils begin to explore linear and nonlinear functions. They then work...
Mathematics Assessment Project
Matching Situations, Graphs and Linear Equations
What do guitars, candles, and helicopters have in common? They're all in this resource. Learners complete an assessment task to determine the amount of profit made in a guitar class based on given information regarding variable...


