Corbett Maths
Average Rate of Change
Simply find the slope to find the average rate of change. A short video provides the definition of the average rate of change. Using the definition, pupils calculate the average rate of change to solve problems that cover finding average...
West Contra Costa Unified School District
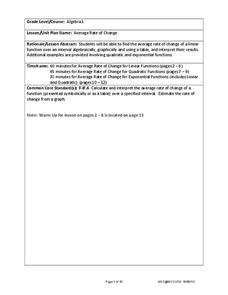
Average Rate of Change
Learners investigate average rates of change for linear functions and connect the concept to slope. They then determine average rates of change in quadratic and exponential functions.
EngageNY
Average Rate of Change
Learners consider the rate of filling a cone in the 23rd installment of this instructional activity series. They analyze the volume of the cone at various heights and discover the rate of filling is not constant. The instructional...
Curated OER
Working with Rates of Change
In this calculus worksheet, students problem solve 8 word problems involving rates of change in association with high school students. Students work out each problem and give a short explanation of each answer.
Curated OER
Mathemafish Population
It's shark week! In this problem, young mathematically minded marine biologists need to study the fish population by analyzing data over time. The emphasis is on understanding the average rate of change of the population and drawing...
Curated OER
The Numbers Behind Hunger: Rate of Change
Explore the concept of world hunger by having students collect and graph 1990 world hunger statistics. They will analyze the data in order to determine how to decrease world hunger rates and try to determine problems and solutions of...
EngageNY
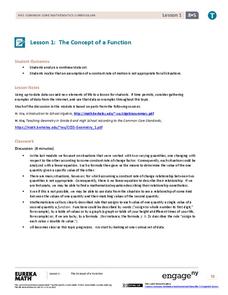
The Concept of a Function
Explore functions with non-constant rates of change. The first installment of a 12-part module teaches young mathematicians about the concept of a function. They investigate instances where functions do not have a constant rate of change.
Virginia Department of Education
Linear Modeling
An inquiry-based algebra lesson explores real-world applications of linear functions. Scholars investigate four different situations that can be modeled by linear functions, identifying the rate of change, as well as the strength and...
EngageNY
Graphs of Simple Nonlinear Functions
Time to move on to nonlinear functions. Scholars create input/output tables and use these to graph simple nonlinear functions. They calculate rates of change to distinguish between linear and nonlinear functions.
EngageNY
Constant Rates Revisited
Find the faster rate. The resource tasks the class to compare proportional relationships represented in different ways. Pupils find the slope of the proportional relationships to determine the constant rates. They then analyze the rates...
EngageNY
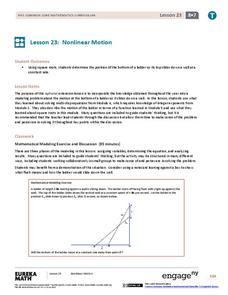
Nonlinear Motion
Investigate nonlinear motion through an analysis using the Pythagorean Theorem. Pupils combine their algebraic and geometric skills in the 24th lesson of this 25-part module. Using the Pythagorean Theorem, scholars collect data on the...
Illustrative Mathematics
The High School Gym
Learners apply critical thinking skills as they analyze data about the temperature inside a gymnasium during a school assembly. The focus is on representing temperature as a function of time and interpreting input and output values...
Curated OER
Slope & Rate of Change
This short handout addresses the concept of slope in two different ways: geometrically and analytically. Start with a brief description of slope, then use graphical representations to compare positive vs. negative slope and zero vs....
Curated OER
Taking Its Toll
Students explore ratios. In this rates instructional activity, students create a ratio to compare the price of a toll to the distance travelled. They compute the average cost per mile, determine the slope between two ordered pairs, and...
Curated OER
Time Changes Everything
Learners analyze census data from 1915, 1967 and 2006. They read an article about how the world's population is growing at an alarming rate. They use primary source documents to create a timeline on the information they gathered. They...
Bowland
110 Years On
How many great, great grandchildren can one have? Scholars estimate the number of descendants a woman can have after 110 years. They use information about the average number of children per family and life expectancy to make this estimate.
Mathematics Common Core Toolbox
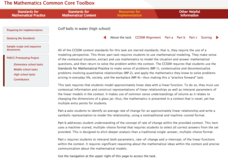
Golf Balls in Water
Here's a resource that models rising water levels with a linear function. The task contains three parts about the level of water in a cylinder in relationship to the number of golf balls placed in it. Class members analyze the data and...
Mathematics Assessment Project
Functions
Studying function means more than simply learning a formula. Learners must use functions to think through four problems and find solutions. Each task utilizes a different concept from a study of functions. Class members might use a...
Mathematics Assessment Project
Journey
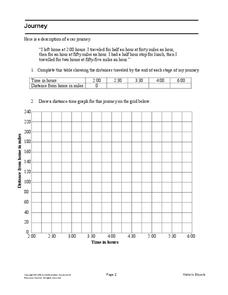
Drive home math concepts with an engaging task. Learners follow a verbal description to fill in a table and create a distance-time graph representing a car journey. They then answer questions by interpreting the graph.
EngageNY
Mid-Module Assessment Task: Grade 8 Module 6
Make sure pupils have the skills to move on to the second half of the module with a mid-module assessment task. The formative assessment instrument checks student learning before moving on to the rest of the lessons in the unit.
Curated OER
Extra Practice 11: Applications With Percents
In this percent worksheet, students read short stories, determine the information needed, write an algebraic equation and evaluate the problem. Problems include simple interest, sale price, and tax rates. There are nine percent problems...
101 Questions
Shower v. Bath
Which requires more water--a bath or a shower? Given some specific criteria, learners attempt to answer the question. A video shows how long it takes to fill a gallon container using a faucet and a shower head. Using that information and...
Curated OER
Carbon Dioxide Increases
For this atmospheric carbon dioxide worksheet, students use a graph of the Keeling Curve showing the increase in atmospheric carbon dioxide since 1958 to solve 6 problems. They determine the rate of increase, the find the percentage of...
Bowland
Cats and Kittens
Can a cat have 2,000 descendants in 18 months? To determine if this claim is realistic, individuals must take different pieces of information into account when justifying their responses.


