Curated OER
Quilting with Middle School Students: Using Proportionality to Develop Quilt Designs
Learners use quilt patterns to illustrate ratios. In this fractions lesson, students color quilt patterns using given fractions and ratios of colors. A finished "quilt" is assembled from the work of the learners. This is an...
Curated OER
Fashion Sense and Dollar Wise
Students work in groups to show understanding of the relationship between fractions, decimals, percentages, and the application of ratios and proportions. In this decimals, fractions, and percents lesson, students use real life consumer...
Curated OER
Working with Percentages and Proportions
In this percentages and proportions instructional activity, students are given percentages, they express them as a proportions, they create an equivalent ratio using "x" for the unknown portion and they cross multiply and divide to find...
Curated OER
What Are the Odds?
Middle schoolers identify and interpret various ways of expressing probability as a decimal, fraction, percent, or ratio. They solve problems based on probability as they apply to real world applications.
Curated OER
Froot Loops to the Max - Team Totals
In this Froot Loops to the Max worksheet, students solve 11 various problems related to determining the team totals found with Froot Loops cereal. First, they determine the number, fraction, percent, and decimal of each color of Froot...
Curated OER
Candy Machine
Using the concept of a candy vending machine, young mathematicians explore the sugar ratios found in different types of candy. Using the provided information, class members calculate and compare different ratios in order to find the...
PBS
Working With Equivalent Fractions, Decimals and Percentages: Activities and Supplemental Materials
Reinforce math concepts using six worksheets that coincide with Virtual Math Girl's video instruction. The practice pages' objectives include writing equivalent fractions, decimal equivalents, and converting percents to decimals and...
Curated OER
Ratio Basketball
Students, in teams of four, practice shooting free throws while mentally converting the ratio of shots made to those thrown into a percent. They chart and record the ratio, decimal and actual percentage earned after each round.
Curated OER
Solving Percent Problems with Proportions
Seventh graders explore the concept of percent problems. In this percent problem lesson, 7th graders use proportion equations to solve percent problems. Students find percentages of numbers and use proportions to determine percents in...
Curated OER
Froot Loops to the Max - 3
Learners complete and solve five questions/problems related to a box of Froot Loops cereal. First, they determine how many of each color of Froot Loops are in the box. Then, pupils determine which color had the greatest frequency and...
Curated OER
Population Ratios
Young scholars access web site and record various population statistics pertaining to a county in the USA of their choice. They use this data to set up and solve ratios. They compare data to make meaning of the numbers.
Curated OER
Problem Solving Decisions: Choose a Method
Walk your scholars through the process of finding percentages using this problem-solving worksheet! A word problem asks students to figure out how many pieces of a puzzle are left, if the completed 750 pieces make up 60% of the total....
Illustrative Mathematics
Gotham City Taxis
Taxi! Have your travelers figure out how far they can go in a taxi for $10.00. They must account for the mileage rate and tip in their calculation. They can set up a table or make an equation to solve for the exact mileage they can...
Curated OER
Word Problem Practice Workbook
Need worksheets that challenge your middle schoolers to apply their understanding of math? Problem solved! From integers, fractions, and percents, to algebra, geometry, and probability, over 100 pages of word problem worksheets are...
Curated OER
Fantasy Baseball
Check out this thematic unit, based on the game of baseball. Learners investigate numbers and number relations as they become familiar with some of the basic terminology associated with the game. They focus their attention on actual...
Curated OER
Practice: Word Problems
Congratulations, you've just hit the word problem jackpot! Covering an incredible range of topics from integers and fractions, to percents, geometry, and much more, this collection of worksheets will keep young mathematicians busy...
CK-12 Foundation
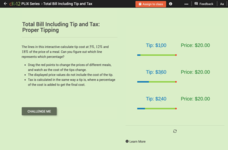
Prices Involving Sales Tax: Proper Tipping
A five-question interactive challenges mathematicians to find a correct tip and total amount using percents five, 12, and 18. A tool with moveable pieces assists participants in locating answers. Types of questions include...
Utah Education Network (UEN)
Analyze Proportional Relationships and Use Them to Solve Real-World Problems
What proportion of learners will benefit from the lessons on proportional reasoning? Class members learn about proportional relationships, from unit rates to writing equations for proportional relationships. Then, they learn to use...
PBS
Real-World Proportional Relationships: Gender Wage Gap
When will the gender wage gap disappear? Scholars use a provided infographic to see trends in wage gap over time. They use ratios of women's wages to men's wages to determine which decades had the greatest change in the wage gap. The...
Bowland
Ice Cream
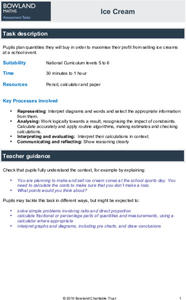
Make sure there is enough ice cream on hand. Learners try to find out how much ice cream to buy for a sports event. Scholars use a pie chart showing the percent of a sample of people who like different flavors of ice cream. Using the...
Bowland
Explorers – Patrol Services
Far out — plan a trip to space! Aspiring mathematicians steer a space vehicle through an asteroid field, calculate currency exchanges to buy provisions, and determine placement of charges to blow up asteroids. Along the way, they learn...
Curated OER
Build a Skittles Graph
Students construct a bar graph with a given set of data. They calculate the ratio and percent of the data. Students discuss alternate ways of graphing the data as well as multiple strategies to approach the task.
Curated OER
Converting Fractions and Decimals
In this conversions worksheet, students convert fractions, decimals, percents, and ratios. Students complete 10 problems in the chart.
Other popular searches
- Percent Proportion and Ratio
- Percent Proportion Ratio
- Percent as a Ratio
- Ratio and Percentages
- Math Ratio and Percent
- Percent Proportions Ratio


