Curated OER
Measuring the Area of a Circle
When mathematical errors happen, part of the learning is to figure out how it affects the rest of your calculations. The activity has your mathematicians solving for the area of a circular pipe and taking into consideration any errors...
Curated OER
Circle Graphs and Percents
In this circle graph and percentages worksheet, learners fill in a chart, write percentages, calculate discounts, and more. Students complete 4 sets of problems.
Curated OER
7th Grade Math Circle Graphs
Seventh graders are able to develop (synthesis) pie graphs with the class and on their own. They are told that pie charts are a graphic representation of material that can be given in the form of parts of a whole by using...
Curated OER
Leveled Problem Solving: Circle Graphs
In this circle graphs worksheet, students solve 6 word problems based on a circle graph about the most popular classes for sixth graders. Students calculate angle measures of circles for 2 of the problems.
Curated OER
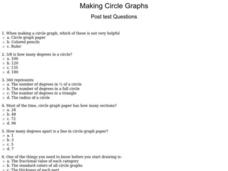
Making Circle Graphs
In this circle graphs learning exercise, learners answer multiple choice questions about how to make circle graphs. Students answer 10 questions total.
Curated OER
The Circle Graph
In this circle graph learning exercise, students complete problems involving many circle graphs including a compass rose, degrees, and more. Students complete 7 activities.
Bowland
Ice Cream
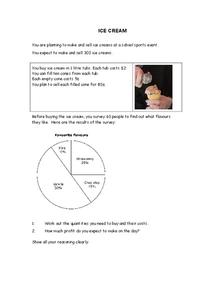
Make sure there is enough ice cream on hand. Learners try to find out how much ice cream to buy for a sports event. Scholars use a pie chart showing the percent of a sample of people who like different flavors of ice cream. Using the...
Curated OER
What's in a Number? Analyzing Smoking Statistics
Sixth and seventh graders analyze smoking statistics. In this health lesson plan, learners look at the percentage of people who smoke from each race group. They create a bar graph and circle graph that displays this information.
Curated OER
Calculate Percentages
Sixth and seventh graders study the concept of finding the percent of a number. They calculate the percent of any given number. Pupils describe ways to use calculating percents in their daily life, and change percents into decimals,...
Curated OER
Our Solar System - Comparing Planetary Travel Distances
NASA presents a mini-unit on distances in our solar system. It incorporates scientific concepts of gravity, mass, density, and payload while your aspiring astronauts also employ mathematics skills. They calculate speed, they determine...
Curated OER
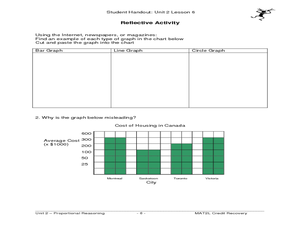
Introduction to Graphs: Bar Graphs, Line Graphs, Circle Graphs
In this graphing data worksheet, students answer 5 short answer questions about graphs. Students determine which type of graph best represents various data sets.
CK-12 Foundation
Pie Charts: Soda Party
Using the interactive, pupils create a pie chart that represents the percentage of sodas bought for a party. Individuals need to determine the percentage and number for the final variety of drinks. The learners determine how the...
Yummy Math
US Holiday Candy Sales
Candy is a big business! Calculate the amount of money consumers spent on major holidays—Easter, Halloween, Christmas, Hanukkah, and Valentine's Day—based on the total amount of candy sales from 2011 and the percentage of each holiday's...
Curated OER
Fractions, Decimals and Percentages
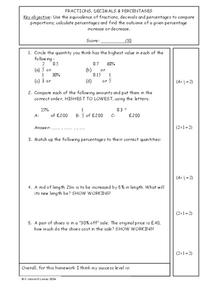
In this fractions, decimals, and percentages worksheet, students compare and order given amounts. Students identify equivalent numbers. They calculate the percent of a given number and convert from a fraction to a percent and to a...
Curated OER
Task: Grain Storage
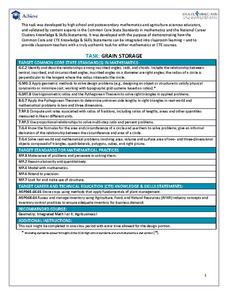
Farming is full of mathematics, and it provides numerous real-world examples for young mathematicians to study. Here, we look at a cylinder-shaped storage silo that has one flat side. Given certain dimensions, students need to determine...
Mathematics Assessment Project
Ice Cream
I scream, you scream, we all determine the amount of ice cream! Pupils calculate the amount of ice cream flavors needed based on survey results in a short summative assessment. They determine the number of tubs and cost of ice cream to...
Curated OER
Time Management: Piece of Pie
Students examine their own lives and how well they manage their time outside of school. In this this time management lesson, students discover the amount of time they spend on other activities, and create a pie chart with that...
National Security Agency
Partying with Proportions and Percents
Examine ratios and proportions in several real-world scenarios. Children will calculate unit rates, work with proportions and percentages as they plan a party, purchase produce, and take a tally. This lesson plan recommends five...
Curated OER
Percent of a Number
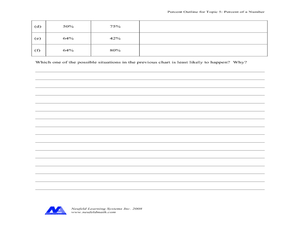
In this percent worksheet, students complete problems such as changing percents to decimals, filling in percentage charts, and more. Students complete 8 problems.
CK-12 Foundation
Complement Rule for Probability: Changes in an Election
Pupils determine the probability of one mayoral candidate winning given the other's chance. The interactive provides a circle graph to help visualize each candidate's percentages of winning.
Curated OER
Graphs: All About Our Class
Students respond to survey questions, discuss results, brainstorm ways to represent survey information, and create table of class results. They find mean, range, and percentages, and create graph to display results.
Yummy Math
Twinkies
Brian was devastated when Hostess® filed for bankruptcy, and he was also fearful that his favorite snack treat would be lost forever. The snack food was in danger of being lost, your class won't be lost when using Twinkies® as the...
EngageNY
Markup and Markdown Problems
There is a 100 percent chance this resource will help pupils connect percents to financial literacy. Young mathematicians use their knowledge of percents to find markups and markdowns in financial situations in the seventh segment in a...
Curated OER
Percent Notation
In this algebra worksheet, students divide circles into equal portions as they explore percents and decimals. They convert between decimals and fractions using ratio and proportion. There are 8 questions.


