Hi, what do you want to do?
TED-Ed
Cicadas: The Dormant Army Beneath Your Feet
What's the buzz that happens every 13 or 17 years? The emergence of the cicadas! This quick and flashy animation explains the lifecycle of these unusual insects and ponders the timing. On the host site, you will also find comprehension...
Anywhere Math
Frequency Tables and Histograms
If the shoe fits, include it in the display. The presentation uses shoe size to introduce organizing data within a frequency table and a histogram. Using another histogram, the video outlines how to interpret the data display. To...
Corbett Maths
Finding Frequencies from Histograms
Drawing and reading a histogram are two different skills. Support those having difficulty making the transition with a lesson that contains video support. Learners may view a pair of videos demonstrating how to read the frequency of a...
PBS
Real-Life Math | Data Analyst
Data is just waiting for scholars to analyze. By viewing a video of a data analyst explaining his job and the math that surrounds it, scholars begin a lesson on data collection and analysis. Groups develop questions for a poll on teenage...
Corbett Maths
Reading Stem and Leaf Diagrams
What are you growing in your math classroom? Scholars use a video lesson to learn how to read a stem and leaf diagram. The video instructor explains how to interpret the key and then explores how to find the range, mode, and median from...
Corbett Maths
Drawing Stem and Leaf Diagrams
Plant the seed and watch it grow! A video lesson teaches learners how to create a stem-and-leaf diagram from a set of data. The instructor discusses the purpose and advantages of organizing data with the diagrams.
Corbett Maths
Interpreting Pie Charts
Not pi, but pie! A video instructor explains how to read and interpret a pie chart. The lesson shows the best way to identify the part of the population in each section of the pie using fractions and/or percents.
Corbett Maths
Reading Pictograms
Let the pictures do the talking! Young scholars learn to analyze data displayed in pictograms using a video resource. They then test their analytical skills by reading and answering questions using several pictogram examples.
Corbett Maths
Drawing a Pie Chart
Easy as pie ... with a little work anyway! A complete lesson provides video instruction on creating a pie chart from a set of data. The practice that follows helps learners draw their own pie charts while practicing skills from the...
Corbett Maths
Line Graphs
Here's a lesson sure to keep classes in line! A straight-to-the-point video explains the steps of creating a line graph from a table of data. Following the video, learners have plenty of opportunities to practice with the included...
Corbett Maths
Reading Histograms
Learn how to read and write histograms. A pair of video lessons instructs learners on the skills required to find the frequency of a range in a population from a histogram. The lesson compares a histogram to a frequency table....
Corbett Maths
Drawing Histograms
Decrease the frequency of histogram-related questions! A well-designed lesson shows how to create and read a frequency histogram using a series of three videos. Learners then complete practice problems that use the concepts shown in the...
Scholastic
Study Jams! Choosing the Correct Graph
With so many types of graphs, don't let your learners get stuck figuring out which one to use. To track how Zoe spent her allowance, use this interactive lesson to review all the types of graphs and pick the best one to display the data....
Khan Academy
Khan Academy: Algebra: Box and Whisker Plot
Video demonstrates how to create a box-and-whisker plot from a set of data. [13:14]
Virtual Nerd
Virtual Nerd: What Is a Box and Whisker Plot?
Learn how a Box-and-Whisker plot is an effective way to interpret data. This tutorial will explain and show examples of Box-and-Whisker plots. [5:35]
Annenberg Foundation
Annenberg Learner: Against All Odds: Histograms
Meteorologists use histograms to map when lightning strikes and this visualization technique helps them understand the data in new ways. [9:42]
Loyola University Chicago
Math Flix: Graphs: Scatter Plot Decoding
This QuickTime movie provides an opportunity to create a data table by analyzing a scatter plot. As you watch and listen to the teacher and student interact it helps clarify the thinking behind applying this concept.
Khan Academy
Khan Academy: Statistics: Box and Whisker Plots
Video demonstrating the creating of a box-and-whisker plot to analyze data. Includes link to practice problems. [10:05]
Khan Academy
Khan Academy: Creating a Histogram
Learn how to create histograms, which summarize data by sorting it into buckets.
Virtual Nerd
Virtual Nerd: Compare Two Data Sets Using Box and Whisker Plots
See how to compare two data sets using box-and-whisker plots. [5:27]
Sophia Learning
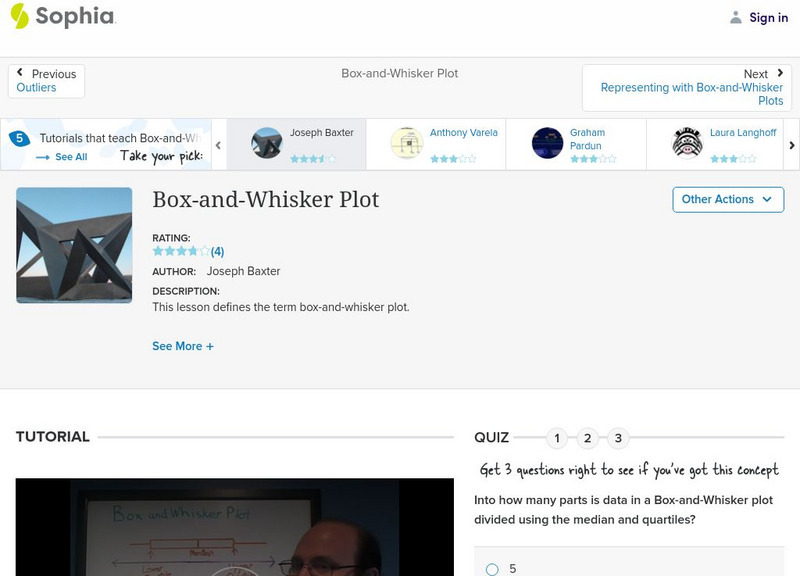
Sophia: Box and Whisker Plot
Box-and-whisker plots are explored in this video tutorial. The lesson reviews how to set up the graph and labels the parts of a box-and-whisker plot.
Sophia Learning
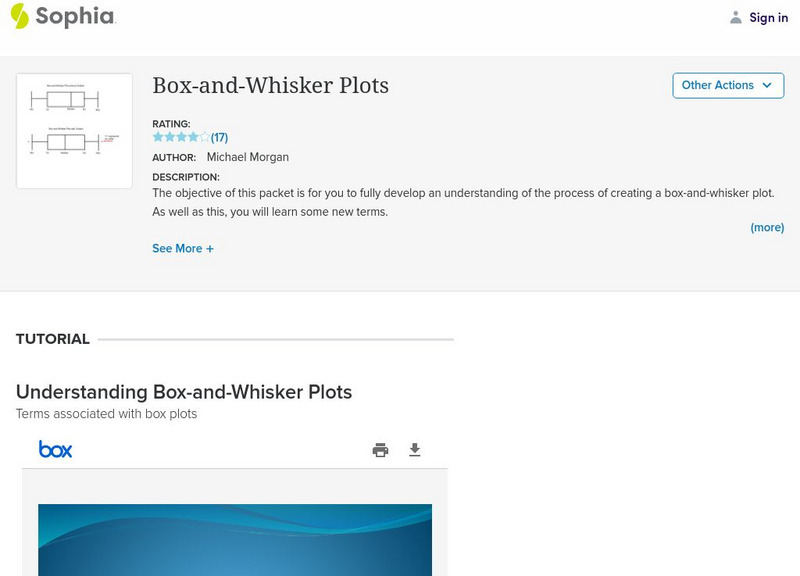
Sophia: Box and Whisker Plots
Box-and-whisker plots are explored in this tutorial. The lesson provides a PowerPoint presentation that defines the terms involved and a video lesson that demonstrates how to create a box-and-whisker plot.
Sophia Learning
Sophia: Graphing Scatter Plots
Use collected data to graph scatter plots on a coordinate plane. Take quiz to check understanding.


