Curated OER
Writing Linear Equations in Slope-Intercept Form
In this writing linear equations worksheet, students find the x- and y-intercepts of 4 equations. Students then write equations for 4 problems given the slope and y-intercepts. Additionally, students rewrite 4 standard form equations in...
Curated OER
Masters Level B: 5.4 The Slope-Intercept Form
In this slope-intercept form, learners identify the x- and y-intercept form of a line. They graph equations using the slope and y-intercept. Students write the equation of a line that contains a pair of points. This one-page worksheet...
Curated OER
Slope of a Line
In this slope of a line worksheet, students solve and graph 2 different problems that include determining the slope of a line using the equation y=mx+b. First, they define the slope of a line and the y-intercept. Then, students use the...
Curated OER
Exploring Slope
In this exploring slope worksheet, students solve and complete 4 different problems. First, they compare an object's weight on Earth to an object's weight on another planet using the information given. Then, students compare this...
Curated OER
Rise Over Run
In this rise over run worksheet, students solve and complete 2 different problems that include determining the rise over run for a race ran. First, they use the information in the table to graph each person's performance using a...
Curated OER
Graphing Linear Equations Cards
OK, so maybe graphing linear equations can be fun. This activity includes a set of linear equation cards to be cut and place face up on a table. Learners pick a card and match it to the correct graph card. This is a really fun way to...
Curated OER
The Slope of a Line
In this slope worksheet, students examine graph and determine the slope of a line. They determine coordinates of a point to make a true statement. Students identify the dependent variable and the independent...
Curated OER
Graphing Lines
In this graphing lines worksheet, students graph lines that are in the point-slope form. They identify the y-intercept and the slope. They graph the equation of a line on a coordinate plane. This four-page...
Curated OER
Graphing
In this graphing worksheet, students solve and graph 10 different problems that include determining various coordinates and the slope. First, they use the table to write the x and y coordinates for each point on the graphs. Then,...
Willow Tree
Slope
Investigate the different types of slope using graphs and ordered pairs. Scholars use the slope formula to determine the slope of a line between two points. Includes examples with a slope of zero and with no slope. The lesson follows a...
Curated OER
Piecewise Linear Functions: Extending Stories to Graphs
Using this resource, scholars develop graphs that model situations by showing change over time. They answer 15 questions based on information from charts that show growth in weight. They extend the concepts to an assessment section of...
Curated OER
Slope of a Line
In this slope of a line activity, learners solve ten problems determining the slope of points and an equation. First, they find the slope of the line containing the two points given in the first five problems. Then, students graph the...
Curated OER
Gra[hing Linear Equations
In this Algebra I worksheet, 9th graders use the slope and y-intercept to graph a linear equation and fill in a table with the coordinates of the five points plotted. The seven page worksheet contains fourteen problems. ...
Curated OER
Writing Linear Equations
In this linear equations activity, 9th graders solve and complete 15 different problems that include writing each in slope-intercept form. First, they state the slope, x-and y-intercepts, and write an equation in slope-intercept form for...
Flipped Math
Modeling with Graphs
Create a graph for anything in the world. Pupils continue to work with graphs that model situations. The learners analyze different graphs to answer questions about the scenario along with finding equations of graphs. Scholars use...
Flipped Math
Graphs of Functions
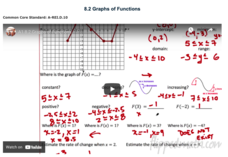
Create a graphical description. Pupils watch a video presentation starting with vocabulary on properties of a graph of a function and then use the vocabulary to find key features of graphs of a function. Scholars use three graphs in the...
Curated OER
Standard Form of a Linear Equation
In this Algebra I/Algebra II learning exercise, students examine the equation of a line in standard form to determine the slope and y-intercept and determine the missing coordinate of an ordered pair. The one page learning exercise...
Curated OER
Writing Linear Equations
In this Algebra I/Algebra II instructional activity, students examine linear equations to determine the slope and y-intercept and write the equation of the line given the pertinent information. The one page instructional activity...
Curated OER
Graphing Linear Equations
In this linear equations worksheet, students graph 2 linear equations using x- and y- intercepts. Students then graph 2 additional equations using the slope and y-intercept method.
Willow Tree
Graphing
So many methods and so little time! The efficient method of graphing a linear equation depends on what information the problem gives. Pupils learn three different methods of graphing linear equations. They graph equations using...
Curated OER
Linear Functions
In this linear function activity, students examine graphs and determine the slope, the y-intercept and the equation of a line. They identify parallel and perpendicular lines. This two-page activity contains 3 multi-step problems.
Curated OER
Review Linear Equations
Explore algebra I/algebra II with this series of worksheets. Pupils write linear equations in slope-intercept and standard form, graph linear equations, and apply linear equations to real world applications. The six-page instructional...
Curated OER
Graphing Linear Functions
In this linear functions worksheet, 9th graders solve and complete 30 different multiple choice problems that include graphing. First, they determine the expression that is equivalent to the given expression. Then, students determine the...
Concord Consortium
Function Project
What if a coordinate plane becomes a slope-intercept plane? What does the graph of a linear function look like? Learners explore these questions by graphing the y-intercept of a linear equation as a function of its slope. The result is a...


