Virginia Department of Education
Exploring Statistics
Collect and analyze data to find out something interesting about classmates. Groups devise a statistical question and collect data from their group members. Individuals then create a display of their data and calculate descriptive...
Workforce Solutions
Miniature Gulf Coast Project
Scholars show what they know about data collection and analysis with an activity that examines a smaller population of Houghton, Texas. Independently or in pairs, learners identify their research question, gather, graph, and analyze...
Cornell University
Density
Certain things just do not mix, including liquids of varying densities. Learners collect data to determine the densities of several liquids. They then use the density information to predict the type of liquid.
Teach Engineering
Organic Solar Energy and Berries
You can eat a solar cell? A unit on solar energy begins with a discussion about organic solar cells, followed by directions on how to build your own. After following the teacher's directions to build an anthocyanin dye-sensitized solar...
College Board
Using the Java Collections Hierarchy
Collect a set of collections. Professional development material provides teachers with information about collections that are in AP Computer Science. Materials include teaching strategies, sample labs, and worksheets. Educators use the...
Curated OER
Energy Audit
Students collect data about energy usage and use mathematical calculations to analyze their data. In this energy conservation and statistics math lesson, students survey their homes to complete an energy usage worksheet. Students...
Curated OER
Independent Plant Growth Experiment
This is an awesome lesson filled with tons of engaging learning activities. Over a period of weeks learners will make observations, collect plant and analyze plant data, read and review agricultural articles, design and conduct an...
Curated OER
Fish Communities in the Hudson
Learning to read data tables is an important skill. Use this resource for your third, fourth, or fifth graders. Learners will will study tables of fish collection data to draw conclusions. The data is based on fish environments in the...
Curated OER
What Are Your Favorite Apples?
In this tally worksheet, students take a survey to determine the favorite apple. They write tally marks beside the apple chosen. For elementary students, this worksheet may be used for counting purposes and to reinforce what a tally mark...
Teach Engineering
Backyard Weather Station
Challenge young meteorologists to apply their knowledge of weather to build their own weather stations. The resource provides the directions to build a weather station that contains a wind vane, barometer, thermometer, and rain gauge....
Howard Hughes Medical Institute
Scientific Inquiry Using WildCam Gorongosa
How do scientists determine what questions to ask to meet their research goals? Help your class develop an inquiry mindset with a lesson based on studies in the Gorongosa National Park. Partners create their own research questions by...
EngageNY
Sampling Variability
Work it out — find the average time clients spend at a gym. Pupils use a table of random digits to collect a sample of times fitness buffs are working out. The scholars use their random sample to calculate an estimate of the mean of the...
Curated OER
Comparing Data on Graph A and Graph B
Second graders gather and graph data. In this graphing lesson, 2nd graders collect data and graph this information using tally charts, bar graphs, pictographs, or tables. They make predictions about the outcomes.
Curated OER
Gathering Data to Problem Solve
Learners, while using reading and writing strategies (subheads, prediction, skim, details, drawing inferences, etc,), solve math problems that involve gathering and representing data (addition, subtraction, multiplication). They practice...
Curated OER
Weather, Data, Graphs and Maps
Students collect data on the weather, graph and analyze it. In this algebra lesson, students interpret maps and are able to better plan their days based on the weather reading. They make predictions based on the type of clouds they see.
NOAA
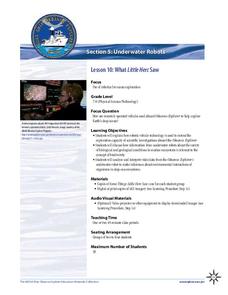
What Little Herc Saw
See the underwater world through a different pair of eyes! Middle school marine biologists identify deep-sea organisms by examining images taken by an ROV from the Okeanos Explorer. After determining what creatures lie beneath the...
Curated OER
Venn Diagrams
The Venn diagram is such a useful tool! It can be used to provide a visual when comparing things across the curriculum. For this case, learners consider three Venn diagrams that each have a unique set of things in them. They must answer...
Curated OER
Collecting Data
In this data collection activity, students read about how data is collected and organized. They also learn about a hypothesis. Students read through examples of different charts and then answer 23 questions pertaining to data collection....
Curated OER
Statistics and Probablility
Statistics and Probability are all about collecting, organizing, and interpreting data. Young learners use previously collected data and construct a picture graph of the data on poster board. This stellar lesson should lead to...
NASA
Developing an Investigation
Watch as your class makes the transition from pupils to researchers! A well-designed lesson has scholars pick a solar wind characteristic to research. They then collect and analyze official data from the LANL website. This is the third...
Curated OER
Bird Ecology Unit
Tenth graders conduct various activities utilizing the scientific method to formulate a hypothesis, conduct a controlled experiment, collect and analyze the data and communicate their results through a poster. They also identify...
Curated OER
Range, Cluster, Gap and Outliers
There are a number of activities here where learners collect and record data, as well as, activities where the likelihood of an event happening is calculated given the experimental probability. Young statisticians organize information...
Curated OER
Bird Ecology Unit
Birds, plants, and vegetation, is there anything more lovely? There is! Engage your class in the scientific process, data collection, and data analysis. They stroll their campus observing and identifying various birds and plants,...
Beacon Learning Center
Line Plots
Introduce line plots, show examples of tables, graphing on a number line, and engage in a class discussion. Share the process by which statistical data is organized and displayed on a number line. Examples and worksheets are included....


