CK-12 Foundation
Regular and Irregular Polygons: Polygon States
Colorado would probably object if Wyoming enlarged its borders. Scholars use an interactive map to change the borders of U.S. states to see how angles change. They then answer questions about regular and irregular polygons.
CK-12 Foundation
Formulas for Problem Solving: Finding Distance, Rate, and Time
Go the distance in learning about distance, rate, and time. Young mathematicians use an interactive to investigate the relationship between distance, rate, and time. A set of challenge questions assesses understanding of these...
CK-12 Foundation
Restricted Domain and Range: Translation of a Curve
Moving the graph of a function obviously changes its domain and range. Scholars adjust the location of a graph in an interactive coordinate plane. The interactive automatically updates and displays the domain and range to show how it...
CK-12 Foundation
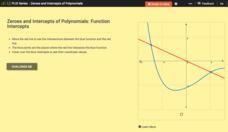
Zeroes and Intercepts of Polynomials: Function Intercepts
There is zero reason not to use the resource. Given a graph with a polynomial function and a linear function, scholars move the line in an interactive. To wrap up the lesson, they note how zeros and intersection points change.
CK-12 Foundation
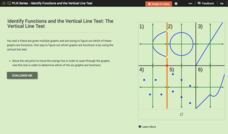
Identify Functions and the Vertical Line Test: The Vertical Line Test
There's no easier test than the vertical line test. Learners drag a vertical line across the graphs of several relations in an interactive. They answer a set of challenge questions that focus on whether the graphs represent functions.
CK-12 Foundation
Sampling Distribution of a Sample Mean: The Mean of the Average Ages
What does it mean to take the mean of the mean? An easy-to-use interactive has users adjust the mean ages of different samples. Finding the average of these sample means gives an estimate of the population mean.
CK-12 Foundation
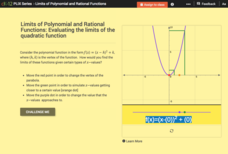
Limits of Polynomial and Rational Functions: Evaluating the Limits of the Quadratic Function
Push an engaging resource to the limit. The interactive allows learners to find a limit on quadratic functions graphically. Using sliders, pupils set the x-value for the limit and to move values from the left and right toward the limit.
CK-12 Foundation
Variance of a Data Set
Use variable value sliders to understand variance. The interactive shows four whole numbers, their mean and deviation. Using the information, pupils find the variance of the numbers and respond to question related to the understanding of...
CK-12 Foundation
Mode: Kittens
It is not as difficult as herding cats. The short interactive provides a group of kittens to sort according to their colors. Pupils determine the mode of the number of kittens by color. The questions continue with other numbers of...
CK-12 Foundation
Mode: Mucho Money
Generate stacks of money. Given bills of different denominations, pupils stack them based on their values. The learners figure out which value is the mode of the data and determine whether the data is unimodal, bimodal, or multimodal.
CK-12 Foundation
Even and Odd Functions and Function Symmetry: Even and Odd Functions (Symmetry)
Even money states that the resource is good to use. Scholars manipulate an interactive to adjust the portion of a graph to the left of the y-axis. The interactive allows them to switch between even and odd modes that show the right side...
CK-12 Foundation
APR and APY: APR vs. APY
Who wins the battle of the interest rates? Scholars use an interactive to investigate three different bank rates. Comparing APR and APY lets them see how nominal and effective rates differ.
CK-12 Foundation
Restricted Domain and Range: Restricted Circle Radius and Area
There's no restriction to how much your class can learn about domain and range. Users of an interactive adjust the radius of a circle to see its effects on the area. They note how restrictions in the domain (radius) relate to...
CK-12 Foundation
Least-Squares Regression
Residual plots let you find the perfect line of best fit. As users adjust the points on a scatter plot and a possible line of best fit, the interactive automatically changes the residual plot. This change allows them to see connections...
CK-12 Foundation
Properties of a Normal Distribution: Uniform Distributions
There's nothing normal about an extraordinary resource. Scholars change the dimensions of a normal distribution using a slider interactive. Determining the area under the graph gives probabilities for different situations.
CK-12 Foundation
Coefficient of Variation: Diverse Populations
What is the height of school clubs? Learners use sliders to calculate the coefficient of variation for three different school groups. Using the calculations, class members compare the variation in the heights of the groups.
CK-12 Foundation
Mode: Boxes of Oranges
See how your data stacks up. Pupils stack crates of oranges in increasing order, creating a simple bar graph. Using the graph, individuals determine measures of center and describe the shape of the distribution. Scholars determine what...
CK-12 Foundation
Mean: Harmonic Mean
Let the means live in harmony. With lengths representing the values of a small data set, learners compare the arithmetic mean to the harmonic mean. The pupils determine which value is the most accurate representation of the average of...
CK-12 Foundation
Mean: Arithmetic Mean
How is a mean affected by changes in data? A well-designed animation allows individuals to manipulate data and watch the effect on the mean. Challenge questions help guide users to conclusions about outliers and skew within data.
CK-12 Foundation
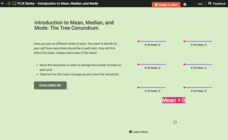
Introduction to Mean, Median, and Mode: The Tree Conundrum
How many trees should we plant? Using an interactive as a manipulative, individuals find the mean, median, and mode for sets of data. They determine the number of trees to plant in each plot of land to reach a statistical goal.
CK-12 Foundation
Stratified Random Sampling: An Extracurricular Study
Learning isn't a random process. A well-designed interactive lesson helps classes make key conclusions about stratified random sampling. They calculate group percentages and use those percentages to decide on sampling totals.
CK-12 Foundation
Simple Random Sampling: How Many Samples Does it Take to Change a Light Bulb?
Teach the concept of simple random sampling through an interactive lesson. Learners explore the concept by considering the strength of sampling methods. Size of the samples varies also as individuals determine which methods lead to the...
CK-12 Foundation
Create and Understand Box-and-Whisker Plots: Babies in a Waiting Room
Explore the strengths and weaknesses of box-and-whisker data display. An interactive lesson asks learners to create a box-and-whisker plot from a set of data. Challenge questions focus on determining what types of conclusions they can...
CK-12 Foundation
Two-Sided Stem-and-Lead Plots: Gamers
Which gender spends more time playing video games? Your classes use provided data to answer this question. They first build a two-sided stem-and-leaf plot and then use the display to look for patterns. Guiding questions help them...


