Graphs and Tables Teacher Resources
Hi, What do you want to do?
Find Graphs and Tables lesson plans and worksheets
Showing 402 resources
University of North Carolina
University of North Carolina: The Writing Center: Scientific Reports
A handout exploring how to complete a scientific report based on scientific research. The site describes the sections needed as well as how to insert graphs and tables.
Texas Instruments
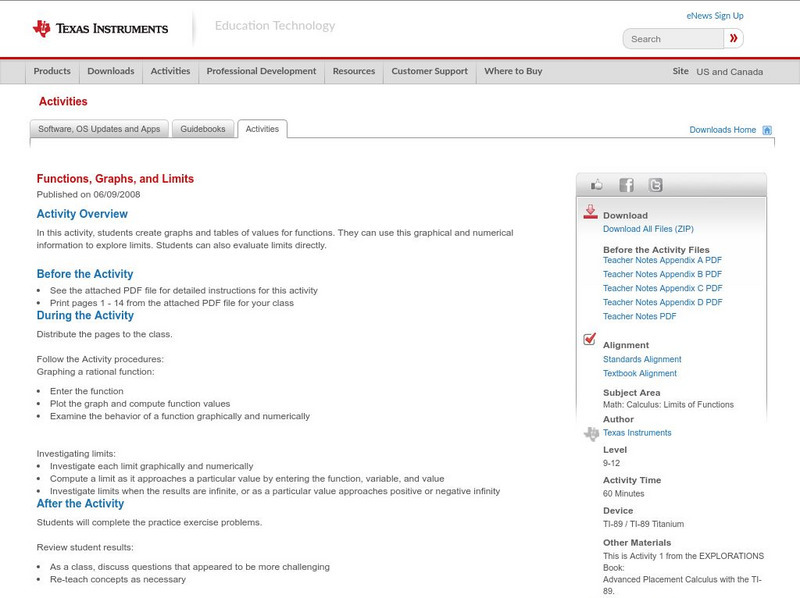
Texas Instruments: Functions, Graphs, and Limits
In this activity, students create graphs and tables of values for functions. They can use this graphical and numerical information to explore limits. Students can also evaluate limits directly.
Texas Instruments
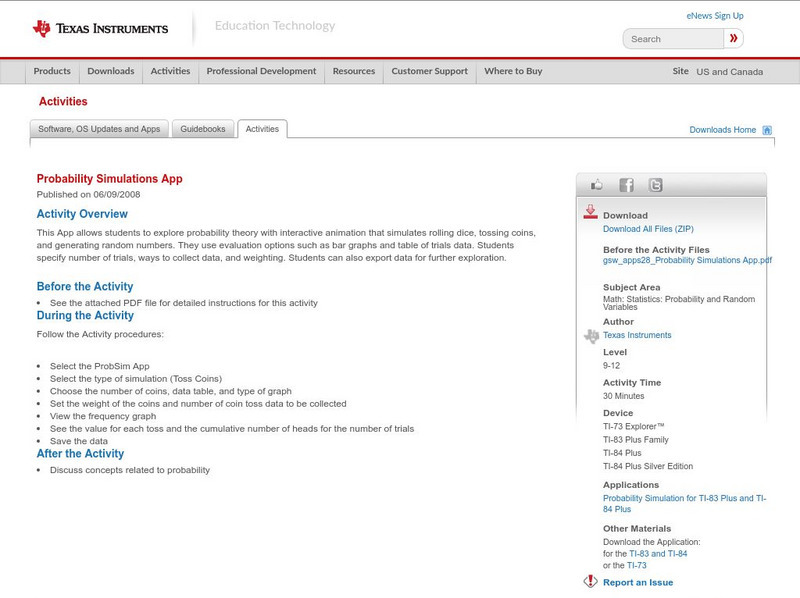
Texas Instruments: Probability Simulations App
This App allows students to explore probability theory with interactive animation that simulates rolling dice, tossing coins, and generating random numbers. They use evaluation options such as bar graphs and table of trials data....
Soft Schools
Soft Schools: Probability and Statistics Quiz
Students are asked to find the mean, median, mode, and range of a data set. Also, they must be able to interpret graphs and tables, and graphically represent data. The quiz is multiple choice and consists of nine questions, and a summary...
Sophia Learning
Sophia: Recognizing Exponential Behavior
This video tutorial reviews how to recognize exponential behavior in sequences, graphs, and tables. The lesson provides detailed examples.
Khan Academy
Khan Academy: Algebra Ii: Functions: Intro to Composing Functions
Explains what it means to compose two functions. Gives examples for finding the values of composite functions given the equations, the graphs, or tables of values of the two composed functions. [6:14]
Khan Academy
Khan Academy: Cancer and Hexokinase
Practice for the MCAT with these questions based on the given graphs and tables about hexokinase.
Better Lesson
Better Lesson: Class Surveys and Graphs
Students love graphing data that they "own". In this plan, the class will select a type of graph and create it using a class survey frequency table. Included in this lesson are videos of the class engaged in the lesson and samples of...
Virtual Nerd
Virtual Nerd: How Do You Use a Circle Graph to Make Predictions?
Learn how to predict using a circle graph by watching this video tutorial. [4:58]
Microsoft
Microsoft Education Lesson Plan: Candy Is Dandy
Explore color distribution of M&M candies using this detailed lesson plan. An engaging integrated lesson that requires understanding of spreadsheets and formulas, and logical reasoning. Links to related websites.
E-learning for Kids
E Learning for Kids: Math: Rice Field: Data and Length
On this interactive website students practice various math skills using a real life scenario of a rice field. Those skills include understanding information displayed in column graphs, collecting data to answer a question, and measuring...
Khan Academy
Khan Academy: Creating Frequency Tables
Practice creating frequency tables from small data sets. Students receive immediate feedback and have the opportunity to try questions repeatedly, watch a video or receive hints.
Other
Nearpod: Reading Picture & Bar Graphs
In this activity on picture graphs and bar graphs, 2nd graders learn key vocabulary, draw the graphs, and compare the graphs.
Khan Academy
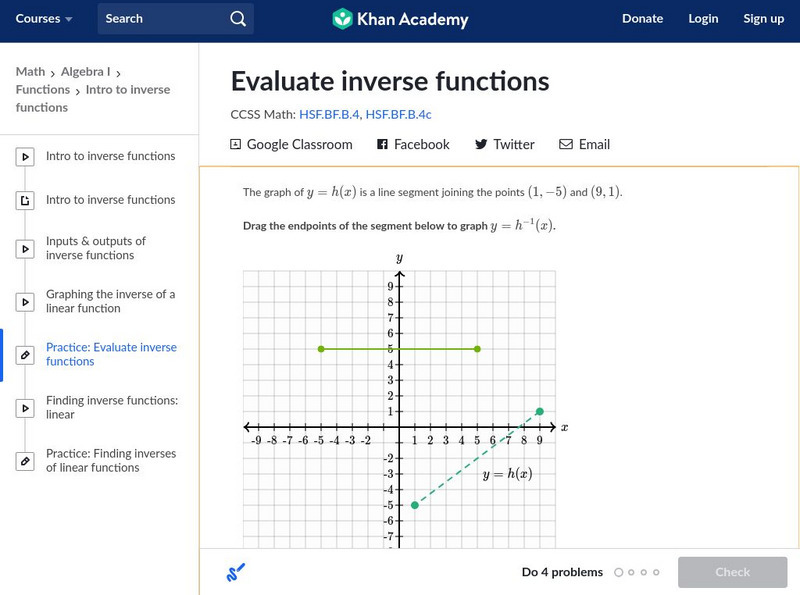
Khan Academy: Algebra I: Evaluate Inverse Functions
Practice evaluating the inverse function of a function that is given either as a formula, or as a graph, or as a table of values. Students receive immediate feedback and have the opportunity to try questions repeatedly, watch a video or...
National Council of Teachers of Mathematics
Nctm: Illuminations: Bar Grapher
Graph data sets in bar graphs.
Shodor Education Foundation
Shodor Interactivate: Comparison of Univariate and Bivariate Data
Learners learn about the difference between univariate and bivariate data and understand how to choose the best graph to display the data.
Khan Academy
Khan Academy: Comparing Data Displays
Practice interpreting and comparing dot plots, histograms, and box plots. Students receive immediate feedback and have the opportunity to try questions repeatedly, watch a video or receive hints.
Virtual Nerd
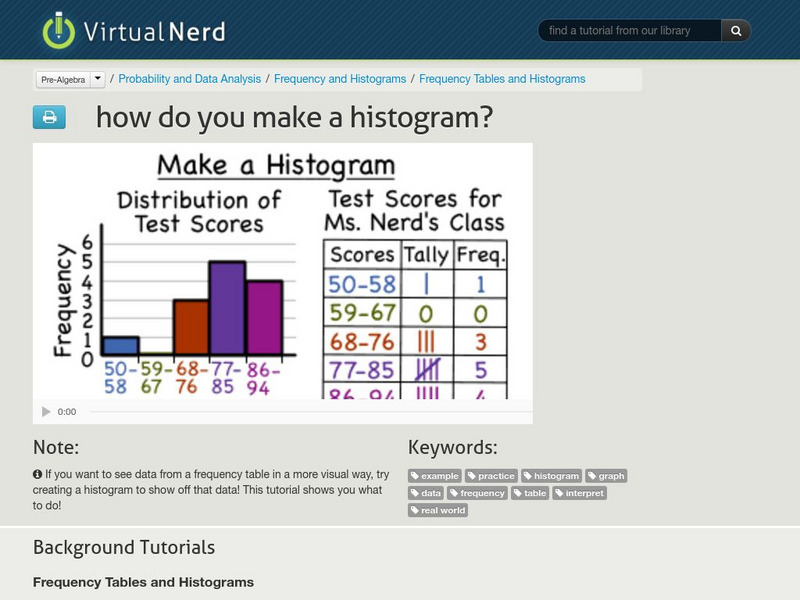
Virtual Nerd: How Do You Make a Histogram?
A histogram is a great way to show off visual data. This tutorial illustrates how to make one. [5:34]
Illustrative Mathematics
Illustrative Mathematics: F Bf Latitude
For this task, learners are presented with data about latitude and the percentage of the Earth's surface north of each latitude line. They are to use this data to sketch a graph, analyze it, and build an understanding of an invertible...
National Institute of Standards and Technology (NIST)
Dictionary of Algorithms and Data Structures: Abstract Data Type
The DADS description of the dictionary abstract data type.
Sophia Learning
Sophia: Writing an Equation for Financial Growth From a Graph or Data Table
In this lesson, students will learn how to write an equation for financial growth using the data in a graph or table. [4:34]
ClassFlow
Class Flow: Interpreting Tables and Graphs
[Free Registration/Login Required] Explore a variety of graphs and tables. Many activities are incorporated to provide practice solving problems using different graphs and charts.
ClassFlow
Class Flow: Curve Sketching
[Free Registration/Login Required] Linear, sine, and quadratic equations are displaying a number of graphs and tables. Challenging and might even challenge the teacher. Go for it.
Virtual Nerd
Virtual Nerd: How Do You Graph a Linear Equation by Making a Table?
See how to graph a function by making a table of values that fir your equation. [3:24]
Other popular searches
- Tables, Charts and Graphs
- Function Tables and Graphs
- Tables and Graphs
- Tables Charts and Graphs
- Create Data Tables From Graphs
- Math Tables and Graphs
- Reading Tables and Graphs
- Data Displays and Graphs
- Tables, Graphs, Charts
- Using Graphs and Tables
- Making Tables and Graphs
- Data Tables and Graphs

